SABER (Schedule Adjusted Basketball Efficiency Ratings) are a metric that I created in order to predict the future results of college basketball games. The article on using College Basketball SABER to predict the results of the 2021 NCAA Tournament can be found here.
The SABER metric works by finding each team’s offensive and defensive rating, then adjusting those values for difficulty of opponent, recency, location of games, and difficulty of conference in order to create a value that accurately captures the team’s offensive and defensive ability. Then, the two values are combined to create a total team rating that can be used to predict future games.
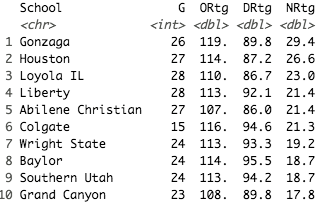
To find each college basketball team’s SABER rating, I use game logs including the team box score stats for every game during the season. First, I calculate the estimated number of possessions for team team using college basketball reference’s formula for possessions, which is found by taking the average of both teams’ field goal attempts plus turnovers plus 0.475 times free throws minus offensive rebounds. Then, the initial offensive and defensive ratings are found by dividing the team’s and opponent’s points by the number of possessions and multiplying by 100. A high value of the offensive rating indicates a good offensive team while a lower value of the defensive rating indicates a good defensive team. When calculating these ratings, I put an upper limit of 130 and lower limit of 70 on each team’s offensive and defensive rating in a game. This was done because games in which a team has a very high or very low offensive or defensive rating can skew the final results and overestimate the impact of huge blowouts.
After that, a weight is given to each game based on the recency of the game and the rough difficulty of the opponent. The weight for recency was calculated by taking the log of 1 plus the game number, creating a weighting system that values results from early in the season less than results from later in the season. Then, that initial weight is then multiplied by 1 if the opponent comes from a power 6 conference (ACC, Big 12, Big East, Big Ten, Pac-12, SEC), 0.5 if the opponent comes from a mid major team, and 0.2 if the opponent is a Division II or Division III school. The weight based on opponent conference is effective because it makes the games played against better schools, on average, more important than those against worse schools.
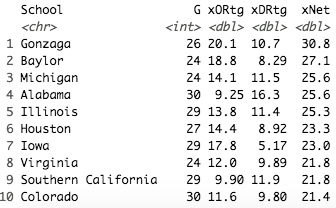
Then, after the weights of each game have been finalized, the weighted average of the offensive and defensive ratings are calculated. These served as the raw team ratings. Next, I found the average opponent offensive and defensive rating. Then, I adjusted both values by 2.5 points based on whether the team played the game at home, away, or on a neutral court (The adjustment was decreased to 2 points for the 2021 season to account for the the decrease in home court advantage due to the pandemic and lack of fans). Finally, the offensive rating over expected (xORTG) was found by taking the raw offensive rating minus the opponent defensive rating, and the defensive rating over expected (xDRTG) was found by taking the opponent offensive rating and subtracting the raw defensive rating. Both of these ratings were then manipulated so that the average xORTG and xDRTG were both 0. Now, a positive value for xORTG or xDRTG indicate a good offense or defense, respectively.

After this step, I noticed that the rankings did not quite accurately depict the best college basketball teams, consistently having teams from obscure conferences at the top of the rankings. Therefore, I adjusted the values so that power 6 teams got a 4 point advantage on offense and defense, which mostly fixed the issue. For this year’s rankings, I also had to include an element that incorporated each conference’s average performance over the last 3 years in order to compensate for the lack of non-conference play for some teams. I also decreased the power 6 advantage to 2.5 points to keep the ratings consistent with previous years. Lastly, the xNet was calculated by adding the xORTG and xDRTG, and it served as the final ranking for each team.