
Expected Points Added (EPA) is a commonly used advanced statistic in football. In short, this stat measures how well a team performs compared to their expectation on a play-by-play basis. EPA and EPA per Play, along with other stats using EPA, can help us evaluate team and player performance.
Table of contents
Calculations and Explanations
In order to calculate EPA for a play, one has to know the expected points before the play and the expected points after the play. Expected points is based on down and yards to go until a first down, and distance to endzone. The values for expected points has been found by taking historical data and computing the average number of points scored by the possessing team in each situation. The graph by The Athletic shown below displays how expected points changes based on distance from the endzone and down, although it leaves out the yards until first down variable.
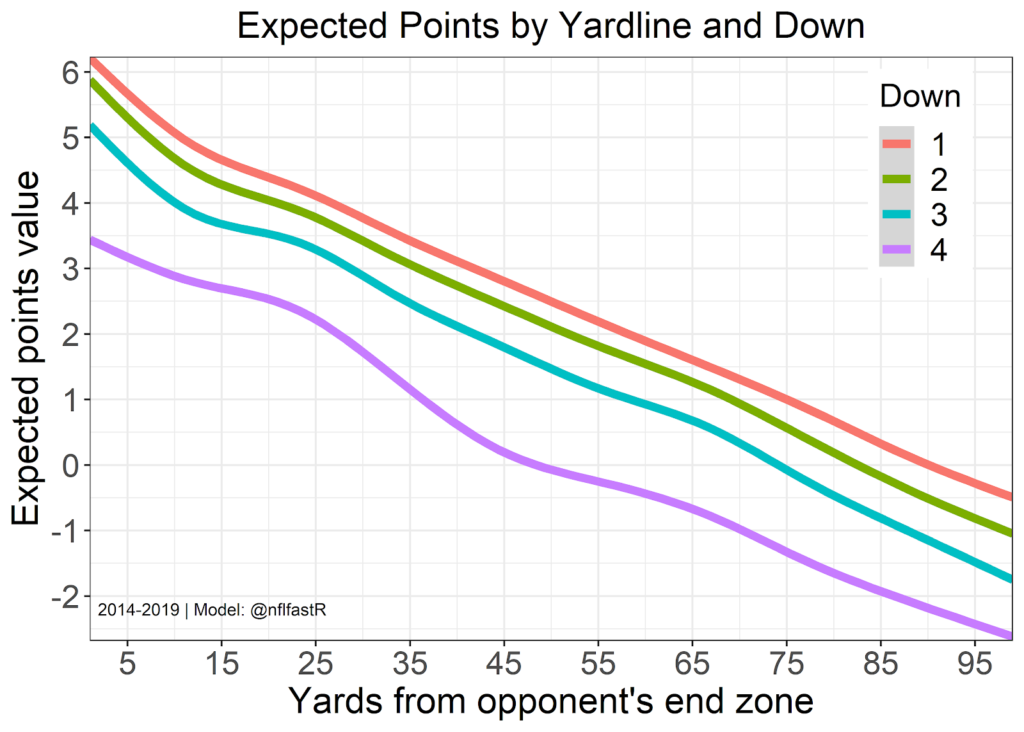
Expected points typically ranges from -3 to 7, and higher values indicate that a team is more likely to score. Therefore, offensive expected points added typically ranges from -14 to 10, because the worst play would be a pick-six from the one-yard line (EP Before = 6.9, EP After = 7) and the best play would be a 99 yard touchdown (EP Before = -3, EP After = 7). EP After for a touchdown is always 7 (or -7 in case of a defensive TD), so it does not account for missed extra points or two-point conversion attempts.
EPA serves as a better tool of measurement for team/player performance because it takes into account that not all yards, touchdowns, and turnovers are equal. In a simple box score, every yard counts the same; however, using EPA allows one to differentiate between a 2 yard gain on 3rd and 10 compared to a 2 yard gain on 4th and 1. Similarly, touchdowns from the 1-yard line are not as valuable as touchdowns from the 50-yard line, and interceptions on a deep throw are not as bad as interceptions when a team is close to scoring. EPA captures all of these effects.
Now that we know how to calculate EPA, we need to know how to use it. EPA can be used to evaluate both teams and players, offensively or defensively. Moreover, since it is a play-by-play statistic, one can filter by situation to find out how teams/players perform in different scenarios.
Team Stats
There are many team statistics that can be derived using EPA. The first is simple: EPA per Play. EPA per Play is simply the mean of the offense’s or defense’s total EPA. An advantage of this stat is that it isn’t too hard to interpret: since the mean of EPA per Play is 0, a positive value indicates a good play whereas a negative value indicates a bad play. The standard deviation of EPA per Play for an offense during a game from 2016 to 2020 was 0.205 and the distribution is Normal, so anyone with knowledge of the empirical rule (or 68-95-99.7 rule) can compute the percentile of an offense during a game with a calculator. For others, this basically means that an offense that has will have an EPA per Play between -0.205 and 0.205 in 68% of games, between -0.41 and 0.41 in 95% of games, and between -0.615 and 0.615 in 99.7% of games. However, it should be known that the mean of EPA per Pass (0.04) is greater than the mean of EPA per Run (-0.06), so the mean of EPA per Play is not 0 for all particular play types and situations. Furthermore, the standard deviation of 0.205 only holds up for game results, NOT season results (those would have a smaller spread).
In addition to using EPA per Play, EPA per Pass, and EPA per Run to evaluate team offense and defense, one can also use Success Rate, Big Play (or Explosive Play) Rate, and Bad Play Rate. Some of these stats have varying definitions, so I will explain them as I use them in my articles and tweets.
Success Rate: The percentage of plays in which an offense has a positive EPA per Play. Success Rate can serve as an indication of consistency as teams with higher Success Rates are more consistent.
Big Play Rate: The percentage of plays in which the offense’s EPA is greater than 0.90, which is the 80th percentile of all offensive plays. Therefore, teams with Big Play Rates greater than 20% are more explosive than average. Success Rate and Big Play Rate have a significant positive correlation, but a low Success Rate with a high Big Play Rate indicates that an offense relies on chunk plays rather than consistency.
Bad Play Rate: The percentage of plays in which the offense’s EPA is less than -0.75, which is the 20th percentile of all offensive plays. Bad Play Rate acts as an opposite to Big Play Rate, so teams with a Bad Play Rate greater than 20% are more prone to make big mistakes. Most often, bad plays consist of turnovers and sacks, but they can also include plays in which an offense fails to make an important conversion (like on 3rd or 4th down)
Player Stats
We can gain extra insight into player performance by using EPA. Obviously, we can use EPA per Play, EPA per Pass, and EPA per Run to evaluate Quarterback, Running Back, Wide Receiver, and Tight End performances. It is especially helpful to divide Quarterback and Running Back performance into their passing and running elements in order to determine their effectiveness in both areas instead of just all together. This way, we can determine the best passing QBs from the best running QBs, or the best running RBs to the best catching RBs.
Additionally, Success Rate, Big Play Rate, and Bad Play Rate (all of which are explained in the previous section) can also be used for player statistics, with the same interpretations. However, one primary difference between player and team statistics using EPA is the role of Total EPA. For teams, Total EPA can be very insightful, but its interpretation is not as useful. For players, however, Total EPA can provide an estimation for how many points the player added above the average NFL player in a given play, game, or season. For example, Lamar Jackson had a Total EPA (Pass and Run combined) of 7.60 against the Chiefs in Week 2 of the 2021 NFL Season. This can be interpreted as Lamar Jackson added 7.60 points to his team’s offensive performance compared to the average NFL player. This way, we can see how much impact a player had on his team’s result. Using the previous example, the Ravens only beat the Chiefs by 1 point, so Lamar Jackson’s 7.60 Total EPA was a significant contribution to his team’s winning effort. Meanwhile, Jalen Hurts had a Total EPA of 3.89 against the 49ers in Week 2 of the 2021 NFL Season, but the Eagles lost by 6 points. Therefore, his performance did not have a large impact on the result of the game. Furthermore, we can expect that the Eagles would have actually lost by 4 more points if they had an average performance from their Quarterback.
