
Shooting is the most important element of the game of basketball. Teams that win the shooting battle very often win basketball games (I think its around 75-80% of the time). Therefore, every basketball team in existence should try their best to acquire the best shooters. The ones who can make difficult shots are even more valuable. However, if you take a look at the top players in the most advanced shooting metric on basketball reference, true shooting percentage, this is what comes up.

The first thing you see is that Mitchell Robinson tops the list. Anyone who watches basketball or knows a little bit about the NBA knows that Mitchell Robinson is very, very far from the best shooter in the NBA. While some results make sense (Duncan Robinson, Seth Curry, JJ Redick, James Harden), many do not at all (Robinson, Gobert, Clarke, Allen). The reason for this is the number of variables that come into play for a single shot. Shot distance, the closest defender, whether it was assisted, and how long a player has had the ball all have effects on the likelihood of a shot being made. So, if there is a way to account for these variables, then we could find the real best shooters in the NBA. Let’s see how this method will work with a new stat: Shooting Above Average (SAA).
Shooting Above Average: How I Found the Formula
To create the formula for shooting above average, I first had to gather stats on all the possible variables that could affect the probability of a shot being made. Using those publicly available, I gathered each NBA player’s season average of several shooting stats: average shot distance, average closest defender, proportion of field goals assisted, average touch time, average dribbles before shot, and average shot clock time remaining. Unfortunately, the data was only available as season averages. Ideally, I would have the stats for each shot, creating a logistic regression using each of the variables as inputs. However, since I did not have these, I ran a linear regression using the season averages of each variable as the inputs. The output is shown below.
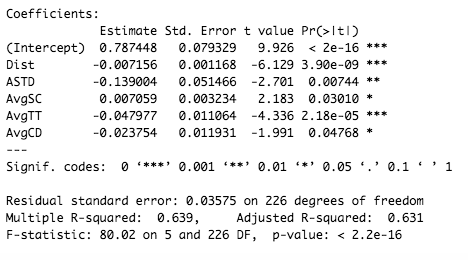
Most of the input coefficients make sense. The distance and touch time are both negative, which makes logical sense. Shooting percentage decreases as shots are further away and decreases and touch time increases. Additionally, shooting percentage increases with more time on the shot clock, which makes sense. However, the coefficients for assisted and closest defender are both negative, which is odd. You would think that a high proportion of assisted shots would mean a higher field goal percentage, but it actually does not. Meanwhile, the closest defender coefficient is likely negative due to its collinearity with average shot distance.
The linear regression output is a player’s expected field goal percentage. Basically, this is a player’s shot difficulty, with a lower value meaning the player takes harder shots. Shooting above average is simply found by residualizing, which means you take a players actual field goal percentage and subtract their expected field goal percentage.
Further Analysis
While creating the linear regression for shooting percentage based on the average circumstances of a player’s shot attempts, I created and looked at a few graphs. The first is a graph of all the variables that I wanted to include in the shooting regression.
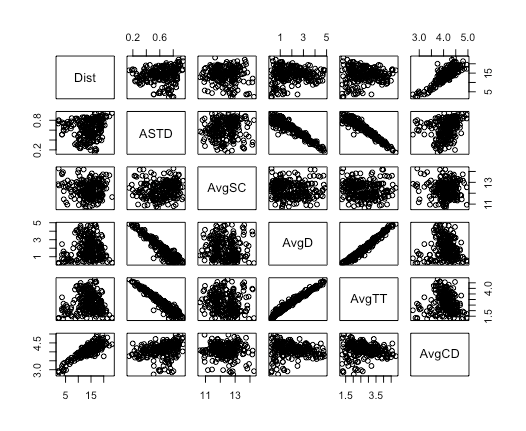
This graph shows the collinearity among the variables I originally included in the regression. Many variables did not have any visible association with each other, but a few did. First, and most notable, was the collinearity between average number of dribbles (AvgD) and average touch time (avgTT). Since there was a high collinearity, I removed the average dribbles variable from the regression. Additionally, proportion of field goals assisted (ASTD) was collinear with both average dribbles and average touch time, which could have an affect it its odd coefficient in the regression output. Lastly, average closest defender (AvgCD) and average shot distance (Dist) were collinear, but I did not remove either variables as I thought both were necessary to include.
Next, I looked at whether the good shooters shot more often than the bad shooters, for all volume shooters (over 10 FGA per game). Here were the results.
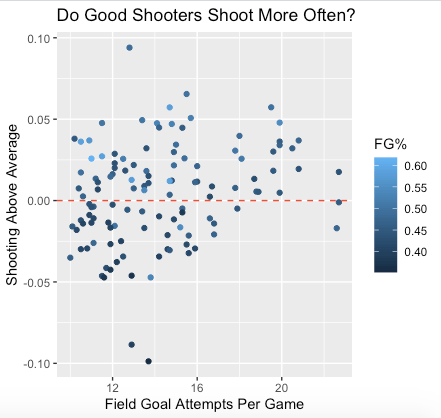
The graph conclusively shows that shooting frequency is not related to shooting quality. The players that have the most field goal attempts (James Harden, Bradley Beal, Russell Westbrook) are actually just about average shooters, given the average circumstances of their shots. Meanwhile, the most spread actually comes around 12 to 16 field goal attempts per game. There was one very good shooter and two very bad shooters, both of which will be revealed in the results section.
An additional analysis that I did was to find the best spacers. Spacers in the NBA are those who are shooting threats from far away, allowing others to drive with more room and become more efficient. I calculated the spacing a player provides by taking his average shot distance then subtracting his average closest defender. The closest defender variables is important because the shooters with their defenders covering them tightly provide more floor spacing. After finding a player’s spacing, I found their adjusted spacing by multiplying by their 3 point percentage, in order to include an element of efficiency. Overall the formula is this: adjusted spacing = 3P% * (AvgDist – AvgCD).
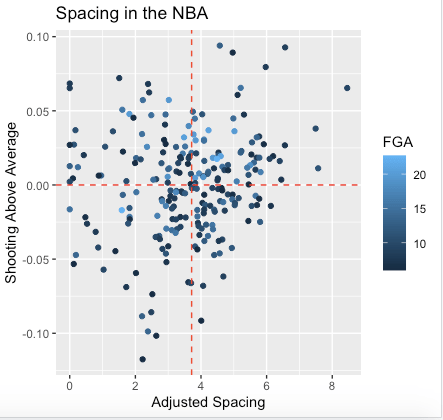
As you can see, there is not really an association. However, one thing to notice is that there aren’t many good spacers that have a very low shooting above average, meaning that the best spacers shoot well given their circumstances (which makes sense). Additionally, some of the non spacers in the NBA (the values between 0 and 2) have a lot of spread, meaning that some players shoot frequently at the rim but still make more shots than they are expected to.
Finally, the last step was to see how predictive these stats I created are. To find this, I plotted the year to year results of both shooting above average and adjusted spacing. A high correlation would mean that the stats are very predictive from year to year, while a low value would mean the opposite. I did this analysis for four different stats: Shooting Above Average, Field Goal Percentage, Expected Field Goal Percentage, and Adjusted Spacing.
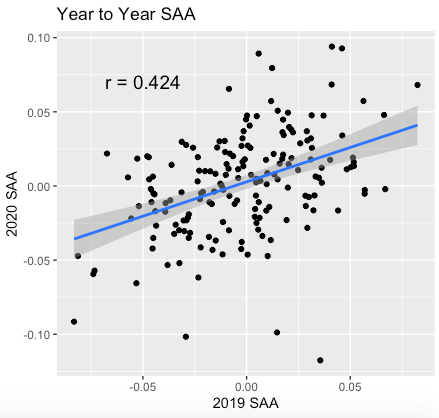
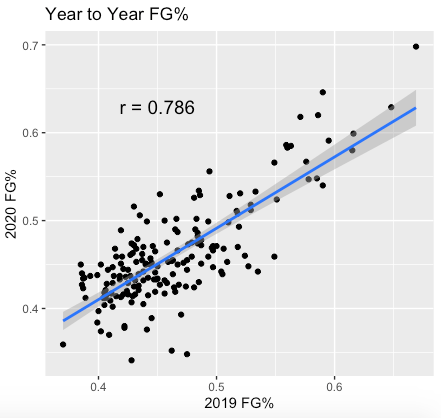
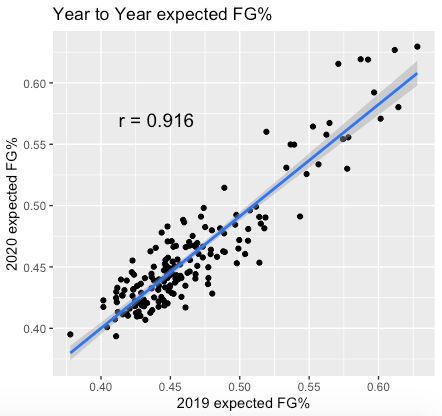
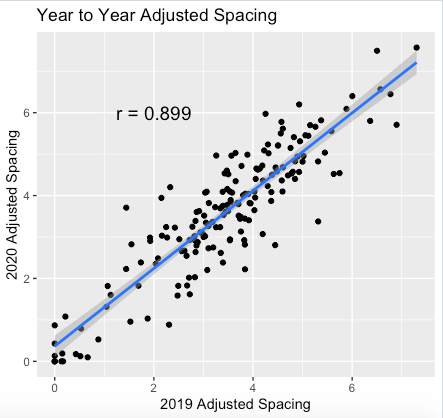
Shooting Above Average actually has a low correlation year to year, meaning that it is not very predictive. However, the expected field goal percentage is very predictive year to year, meaning that players’ usually take similar shots and do not change their shot selection very much. Moreover, field goal percentage has a high year to year correlation, with a 0.786 correlation. Adjusted Spacing also has a high correlation, so the best spacers usually remain good. Something interesting is that both field goal percentage and expected field goal percentage have high correlations, but Shooting Above Average, which is calculated by subtracting these two values, actually has a low correlation. However, in conclusion, while Shooting Above Average can effectively find the best shooters given the circumstances, it is not good for predicting future performance.
Results
Now that the formulas and analysis is completed, we can take a look at the results. To quickly browse over some of the players, I will look at the best shooters, worst shooters, the high volume shooters, and the players of the best shooting teams. Additionally, I will be using both the 2019 and 2020 seasons since many high profile players have been injured for the majority of this season (such as Kevin Durant, Steph Curry, Klay Thompson, Kyrie Irving). Lastly, I will be using Field Goals Above Average (abbreviated FGAA) to rank the players. The formula for this is Shooting Above Average times field goal attempts per game. This stat takes into account volume while also valuing shooting quality. The value can be interpreted as the number of field goals a player makes over expected in a single game.
Note: A good FGAA is around 1 while a good SAA is anything over about 0.05. A really good spacing is anything above 5 or 6. Superstars often won’t have a great spacing since they usually score in a multitude of ways.
The Best Shooters
1. Kevin Durant, SF, GSW (2019)
FGAA: 1.37 | SAA: 0.078 | Spacing: 3.89 | FG%: 0.521 | exp FG%: 0.443
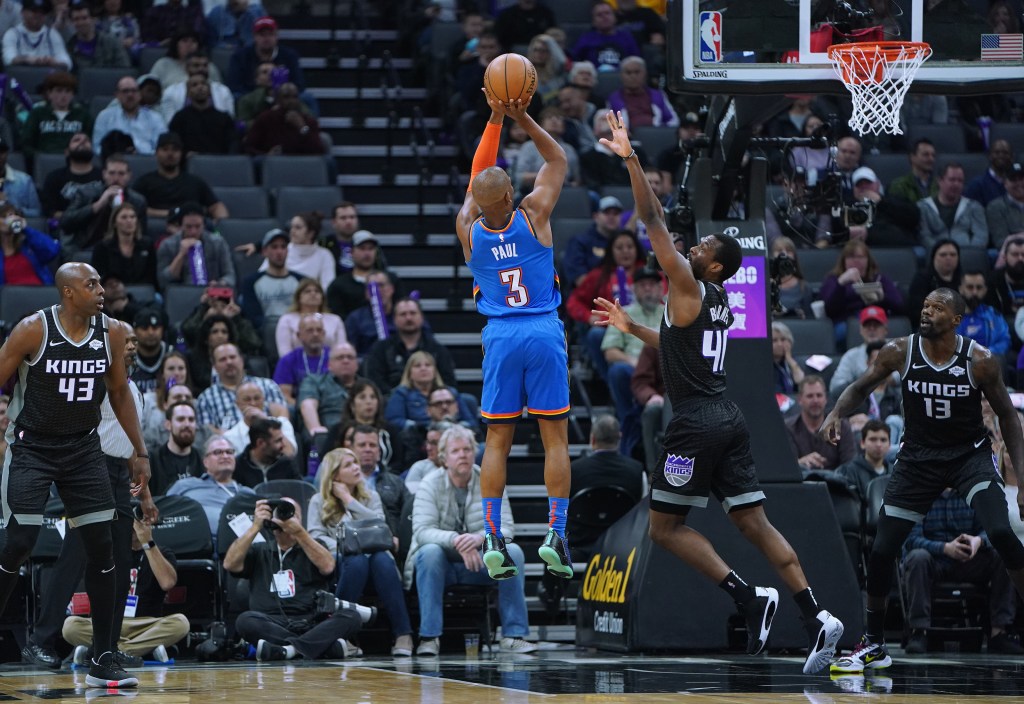
2. Chris Paul, PG, OKC (2020)
FGAA: 1.20 | SAA: 0.094 | Spacing: 4.57 | FG%: 0.489 | exp FG%: 0.395
3. Giannis Antetokounmpo, PF, Mil (2019)
FGAA: 1.14 | SAA: 0.066 | Spacing: 1.07 | FG%: 0.578 | exp FG%: 0.512
4. LeBron James, PG, LAL (2020)
FGAA: 1.11 | SAA: 0.057 | Spacing: 3.02 | FG%: 0.498 | exp FG%: 0.441
5. Khris Middleton, SF, Mil (2020)
FGAA: 1.01 | SAA: 0.065 | Spacing: 5.21 | FG%: 0.499 | exp FG%: 0.434
The best shooters given the circumstances produced several interesting results. The first place player was Kevin Durant, by a lot. His high shooting above average combined with high volume gave him a FGAA of 1.37. Giannis making an appearance was especially surprising to me, but this means that he greatly outperforms his expectation near the rim. The Bucks had another star in Khris Middleton make an appearance. A few players I was surprised that were not here include Steph Curry and James Harden, each of whom take difficult shots but convert at a good rate.
Numbers 6-10: James Harden (2019), Steph Curry (2019), Kawhi Leonard (2019), John Collins (2020), Seth Curry (2020)

The Worst Shooters
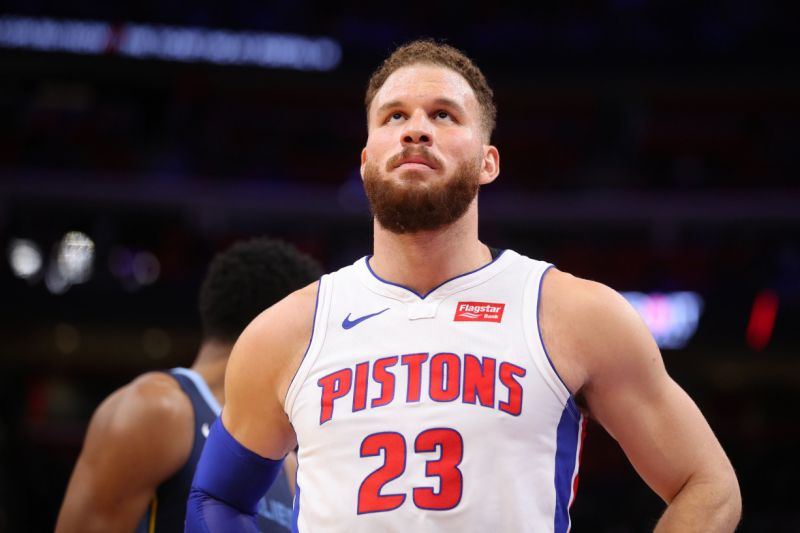
1. Blake Griffin, PF, Det (2020)
FGAA: -1.36 | SAA: -0.099 | Spacing: 2.38 | FG%: 0.352 | exp FG%: 0.451
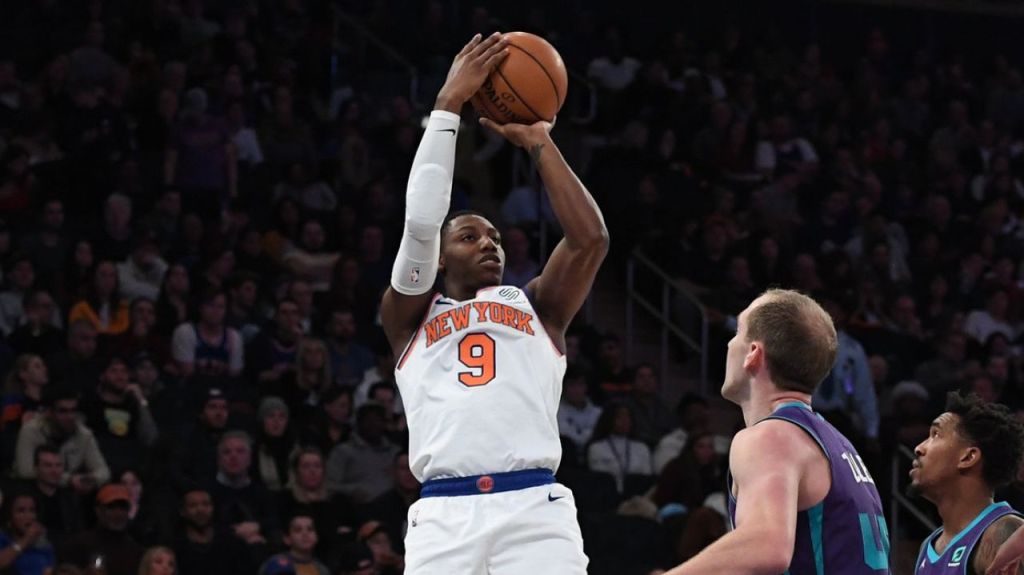
2. RJ Barrett, SG, NYK (2020)
FGAA: -1.15 | SAA: -0.089 | Spacing: 2.20 | FG%: 0.402 | exp FG%: 0.491
3. Andre Drummond, C, Det (2019)
FGAA: -1.07 | SAA: -0.081 | Spacing: 0.15 | FG%: 0.533 | exp FG%: 0.614
4. Kevin Knox, PF, NYK (2019)
FGAA: -1.01 | SAA: -0.083 | Spacing: 3.80 | FG%: 0.370 | exp FG%: 0.453
5. Rondae Hollis-Jefferson, SF, Brk (2019)
FGAA: -0.91 | SAA: -0.110 | Spacing: 0.58 | FG%: 0.411 | exp FG%: 0.521
The worst shooters were led by Blake Griffin, who had a terrible, injury plagued season this year. Before his injury, he was no help to the Pistons, being very efficient with a high volume. Knox and Barrett are two players that are contributing to the Knick’s struggles with bad shooting, although the Knicks need to play their young players. They just have to hope they improve. Rondae Hollis-Jefferson had a surprisingly bad shooting season in 2019, with a league-worst -0.110 SAA. Others who were close to showing up were Russell Westbook (below average shooting but huge volume) and Kevin Love.
Numbers 6-10: Russell Westbrook (2019), Kevin Love (2019), Tim Hardaway Jr (2019), Jarrett Culver (2020), Andrew Wiggins (2019)
High Volume Shooters
1. James Harden, PG, Hou (2019)
FGA: 24.5 | FGAA: 0.98 | SAA: 0.040 | Spacing: 4.71 | FG%: 0.442 | exp FG%: 0.402
2. Bradley Beal, SG, Was (2020)
FGA: 22.7 | FGAA: -0.02 | SAA: -0.001 | Spacing: 3.79 | FG%: 0.455 | exp FG%: 0.456
3. Russell Westbrook, PG, Hou (2020)
FGA: 22.6 | FGAA: -0.38 | SAA: -0.017 | Spacing: 1.59 | FG%: 0.474 | exp FG%: 0.491
4. Paul George, SF, OKC (2019)
FGA: 20.9 | FGAA: -0.19 | SAA: -0.009 | Spacing: 4.82 | FG%: 0.438 | exp FG%: 0.447
5. Trae Young, PG, Atl (2020)
FGA: 20.9 | FGAA: 0.40 | SAA: 0.019 | Spacing: 4.60 | FG%: 0.437 | exp FG%: 0.418
James Harden and Russell Westbrook have had very high usage for the past two seasons, so it’s no surprise that they appear on this list. However, among the most high volume shooters of the past two seasons, most have been very close to average shooting given their circumstances. The exceptions to this are James Harden and Trae Young, both of whom shot better than expected. Meanwhile, Russell Westbrook shoots worse than expected, while Beal and George shoot very close to what they are expected to. Some high volume shooters who shoot much better than expected that do not appear on this list are as follows: LeBron James, Kyrie Irving, Luka Doncic, Kawhi Leonard, and Damian Lillard.
Underrated Shooters (given circumstances)
Chris Paul, PG, OKC
FGAA: 1.20 | SAA: 0.094 | Spacing: 4.57 | FG%: 0.489 | exp FG%: 0.395
George Hill, PG, Mil
FGAA: 0.56 | SAA: 0.089 | Spacing: 4.97 | FG%: 0.530 | exp FG%: 0.441
Rodney Hood, SF, Por
FGAA: 0.66 | SAA: 0.080 | Spacing: 5.97 | FG%: 0.506 | exp FG%: 0.426
Brandon Clarke, PF, Mem
FGAA: 0.58 | SAA: 0.072 | Spacing: 1.51 | FG%: 0.623 | exp FG%: 0.551
Thomas Bryant, C, Was
FGAA: 0.54 | SAA: 0.068 | Spacing: 2.39 | FG%: 0.0.599 | exp FG%: 0.531
Some of the more underrated shooters given their circumstances include Chris Paul, George Hill, and Rodney Hood. Paul has a great shooting season, one of the reasons the Thunder are doing so well. George Hill is, I believe, an underrated player in general, with his shooting being one of the things that make him under appreciated. Rodney Hood was shooting very well before getting injured. Lastly, two big men who deserve some appreciation are Brandon Clarke and Thomas Bryant. Both have been better than expected while taking most of their shots at the rim. Both can develop into key players as they are young and are showing potential.
Other Underrated Shooters: Richaun Holmes, Shake Milton, Christian Wood, DeMar DeRozan, Gordon Hayward
The Best Spacers
1. Duncan Robinson, SF, Mia (2020)
FGAA: 0.61 | SAA: 0.065 | Spacing: 8.46 | FG%: 0.467 | exp FG%: 0.402
2. Davis Bertans, PF, Was (2020)
FGAA: 0.12 | SAA: 0.011 | Spacing: 7.57 | FG%: 0.434 | exp FG%: 0.423
3. JJ Redick, SG, NOP (2020)
FGAA: 0.39 | SAA: 0.038 | Spacing: 7.49 | FG%: 450 | exp FG%: 0.412
4. Kyle Korver, SG, Cle/Uta (2019)
FGAA: 0.05 | SAA: 0.008 | Spacing: 7.18 | FG%: 0.416 | exp FG%: 0.408
5. Danny Green, SG, Tor (2019)
FGAA: 0.23 | SAA: 0.029 | Spacing: 6.90 | FG%: 0.465 | exp FG%: 0.436
Each of these players should be pursued by any team. Great spacers are the types of players that can fit with any team. Each of them take shots mostly from outside while converting at a high clip. Duncan Robinson leads the pack with a very high adjusted spacing of 8.46. Bertans will be a free agent this year, so he should get paid nicely. However, while these players are very valuable, teams should be wary in paying them too high a premium since they usually do not provide much value outside of their shooting (other than Danny Green, who is a great defender). Redick and Korver have been longtime great shooters, and Danny Green will try to help the Lakers win the championship this year.
Numbers 6-10: Landry Shamet (2019), Stephen Curry (2019), Seth Curry (2019), Ben McLemore (2020), Wayne Ellington (2019)
Conclusion
Using a player’s average circumstances to determine their true shooting ability is very helpful. The results contained players that made a lot of sense, along with a few surprises. Using Shooting Above Average, we can take into account many variables that influence shots and use them to find their expected field goal percentage and see who is doing better than they should be. Some findings outside of the best and worst shooters given circumstances included underrated shooters and the best spacers in today’s NBA. Shooting Above Average is a very insightful new shooting metric that can be used to find some hidden value among NBA players.
The calculations and top 25 leaderboards for shooting above average, field goals above average, and adjusted spacing can be found in separate pages.


Very interesting
LikeLike
Interesting
LikeLike