
Most of NBA analysis is pointed towards offense. Popular stats like points, assists, turnovers, and shooting efficiency all evaluate offensive ability, while defensive stats are often neglected. However, a great defense can lead a team to a deep playoff run: in the last 5 seasons, 64% of the teams with a top 5 regular season defensive rating made the conference semi-finals. The roles that big men play in a team’s defense differs from the roles that guards and wings play. Looking at defensive statistics can also tell us where teams should focus their resources and which types of players they should sign to improve.
Team Defense
Defense in basketball can be broken down into four sections: shooting defense, forcing turnovers, rebounding, and avoiding fouls. The most important element is shot defense. Therefore, the key to a good defense is to limit opponent shooting efficiency.
Limiting opponent shooting efficiency can come in two ways: the first is to force opponents to shoot worse (like forcing opponents to shoot worse at the rim), and the second is to force opponents to take lower-percentage shots (like forcing opponents to take more mid-range shots). In order to see the sustainability of these strategies, we can look at year-to-year correlations for some shooting statistics.
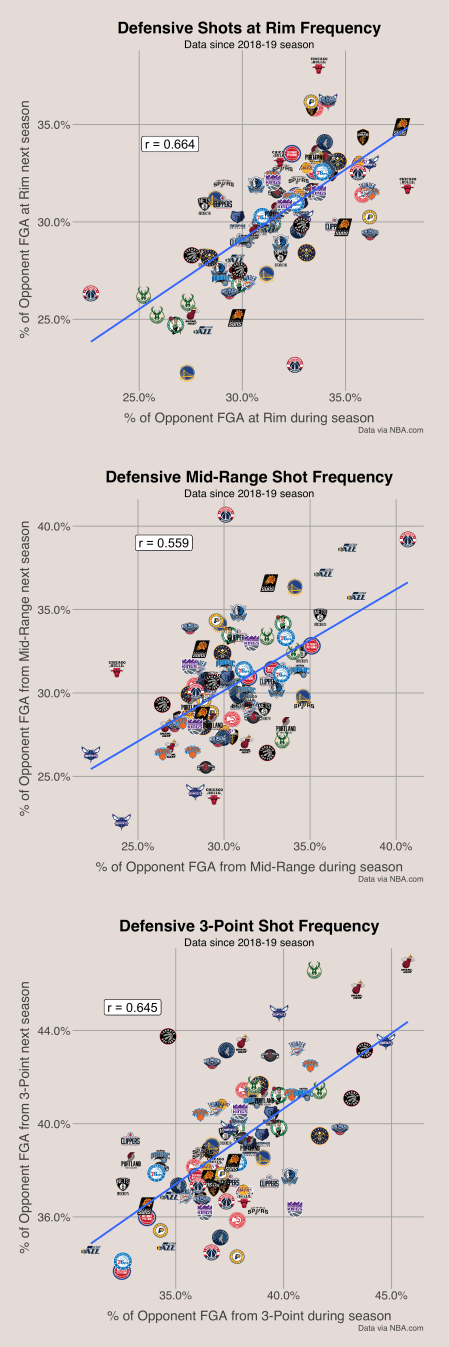
First, we can break opponent shooting into the frequency of shots taken at the rim (defined as within the restricted area), from mid-range (defined as the area between the restricted area and the 3-point line), and from three. If the year-to-year frequencies have a high correlation, then we can say that teams have a high degree of control over where opponents take shots, and if the correlations are low, the results are more likely to be impacted by random chance. As seen by the graphs below, the year-to-year correlations for all three frequencies are between 0.55 and 0.67, meaning that opponent shot selection is something defenses can control.
Next, we can apply this method to opponent shooting percentage. For shooting percentage, I included another category: wide-open 3-point percentage. A wide-open 3-point shot is classified as a 3-point attempt where the closest defender is 6 or more feet away. The shooting percentage year-to-year correlations are shown below.
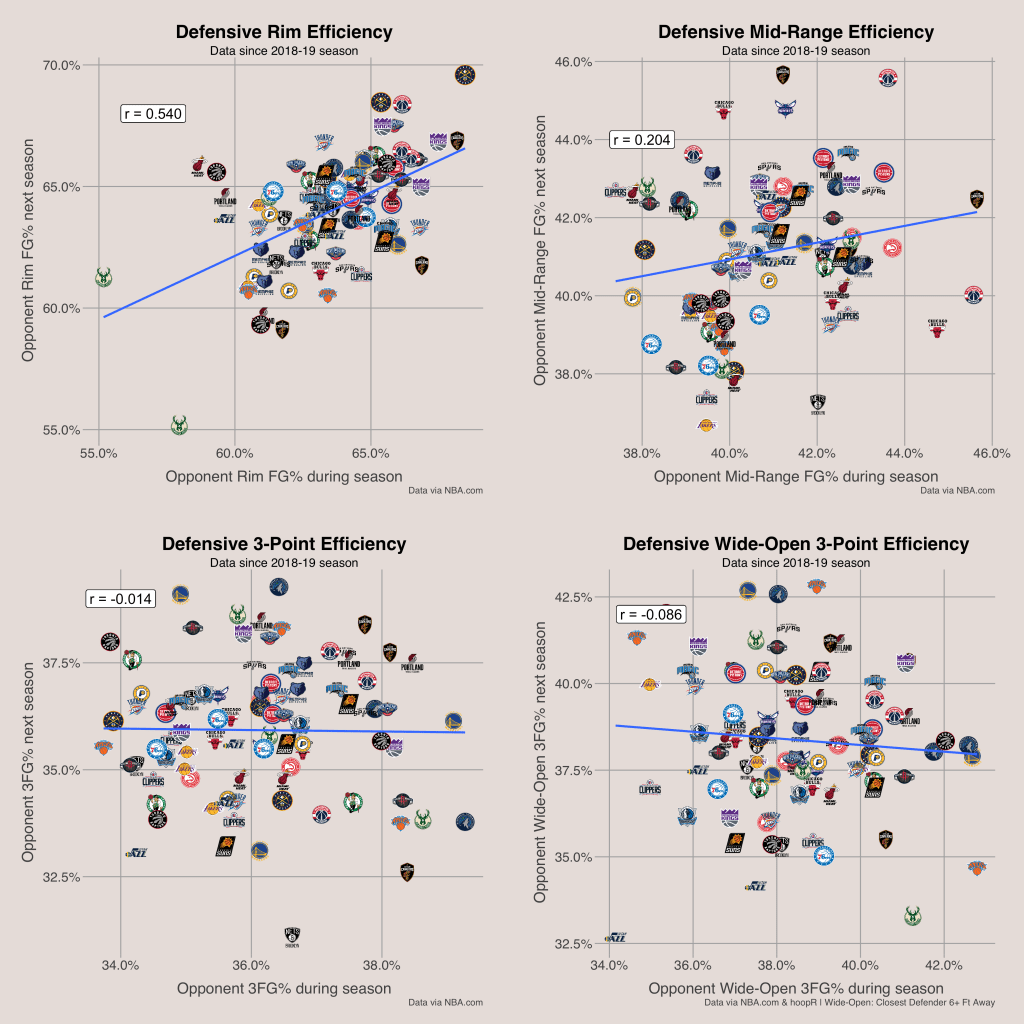
The graphs above tell us a lot about how NBA defense works. In the top left graph for the consistency of opponent shooting at the rim, there is a visible positive correlation between an opponent’s field goal percentage at the rim in one year and the next year. That cannot be said for any other category. Therefore, we can conclude that NBA defenses have the greatest power over their opponents’ shooting efficiency at the rim, while efficiency from 3-point range is largely a factor of luck. Because of this, teams should invest more in rim protectors as opposed to perimeter defenders.

Evaluating Defenses
Using the information on the consistency of different shooting stats found in the previous section, we can evaluate how an NBA defense would be expected to perform. We saw that teams do have an ability to force their opponents into specific shots based on the way they play since the consistency of the frequency of shots from the rim, mid-range, and three were high.
Now that we know teams can do this, the question is which shots teams should try to force opponents to take. The obvious one is mid-range: these shots have a low probability of being made because they are far from the rim, and they don’t have the benefit of added value like 3-pointers do. The average points per shot for four different types of shots are shown below.
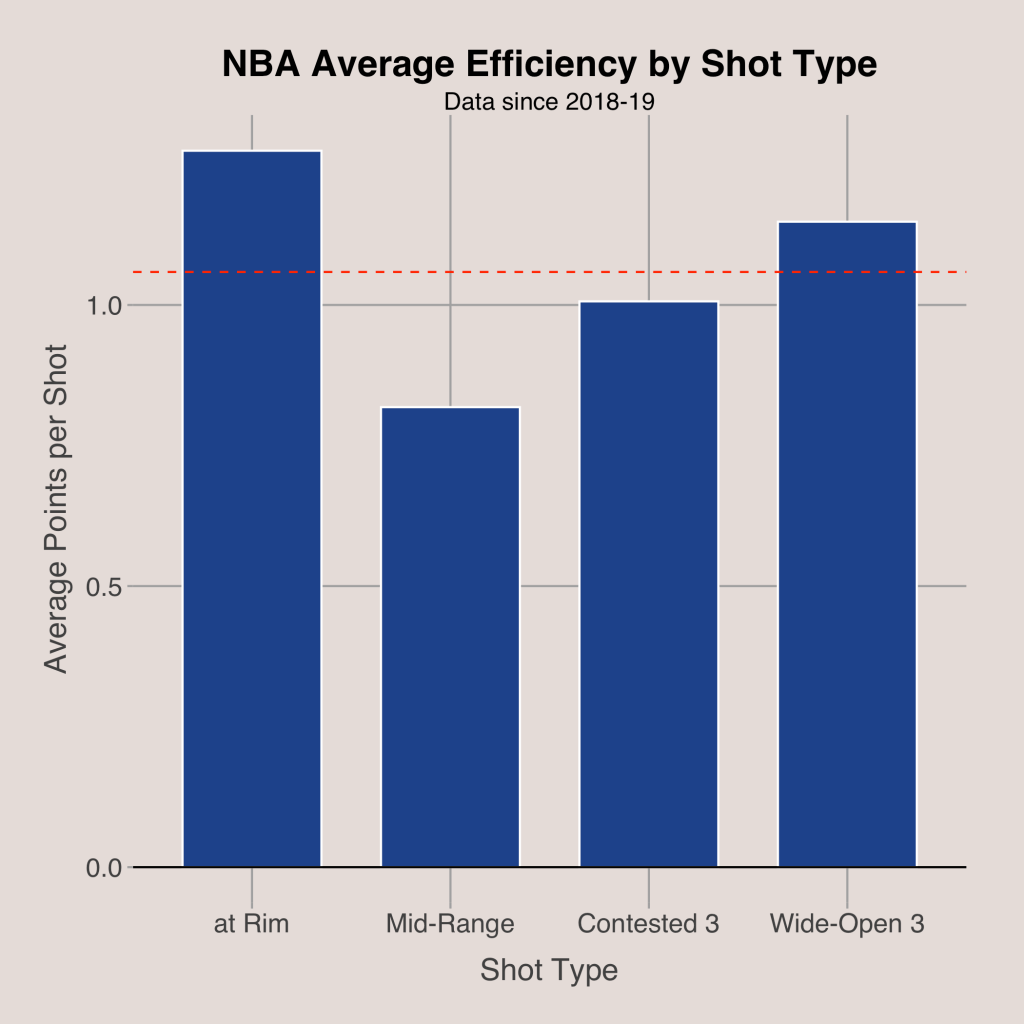
Shots at the rim have the most value for an offense, with an averages points per shot of 1.274. After that is wide-open 3’s then contested 3’s, with 1.148 and 1.006 points per shot, respectively. Last is mid-range shots with an average of 0.818 points per shot.
Since shots at the rim are the most efficient for offenses, defenses should obviously try to limit these, while forcing more mid-range shots. Using the average points per shot for each type of shot, we can find the expected points per shot for each defense. This is based only on the frequency of shot types for each team and the league average points per shot from each range.

In the graph above, teams towards the right are forcing their opponents to take worse shots. These include the Warriors, Suns, Jazz, and Wizards, each of which are forcing lots of shots from mid-range and few shots at the rim (shown below).

Teams like the Nets, Clippers, and Cavaliers (teams that have a high expected points per shot and a low actual points per shot) are not thriving by forcing their opponents to take difficult shots, but rather because their opponents are shooting worse than expected. This is mostly skill if the poor opponent shooting is from the rim, but luck if it is from behind the arc.
One way to look at how lucky a team is getting is to see what their opponent points per shot would be if their opponents shot the league average efficiency on contested threes and wide-open threes. We do this because there is at least some degree of consistency in rim and mid-range defense, but none in three-point defense. The graph below shows which defenses have been getting the most lucky on opponent three-point shooting. The Adjusted Opponent Points per Shot is the opponent points per shot if opponents shot league average on contested and wide-open threes (33.5% for contested, 38.3% for wide-open).

From this, we can see which defenses this season have been the best, factoring out 3-point luck. The Suns, Warriors, Clippers, Jazz, and Bulls have the best defenses, while the Hornets, Rockets, and Nuggets have the worst. The Hornets and Rockets don’t force enough mid-range shots, and the Nuggets have the worst rim defense in the league. The Suns, Warriors, and Jazz thrive by forcing their opponents into bad mid-range shots and preventing shots at the rim, while the Clippers and Bulls are good because they have a strong rim defense (3rd and 4th in opponent FG% at the rim, respectively).
Evaluating Players
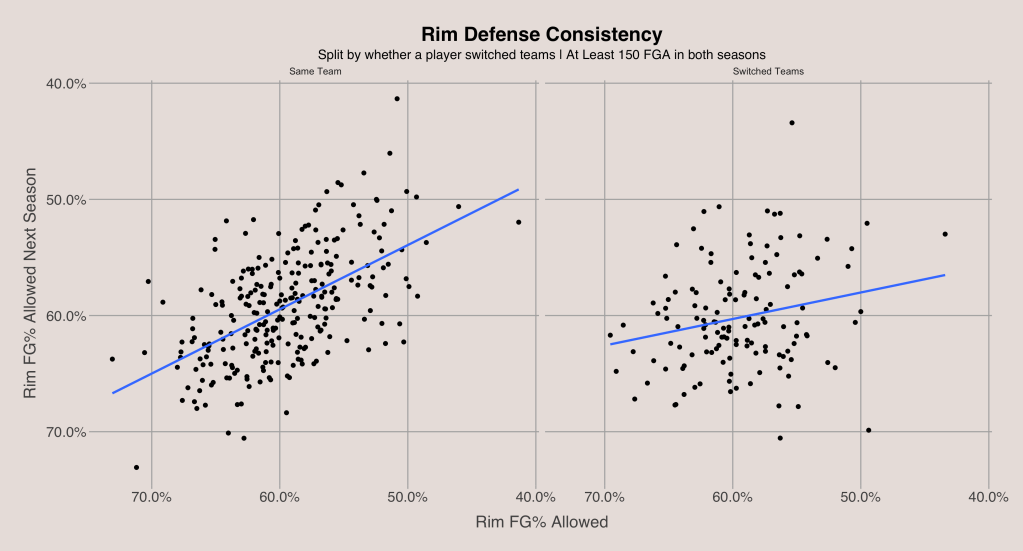
We already found that the most consistent type of shot defense is rim defense. Therefore, teams should try to build a defense with a strong rim protector. Based on the high team rim shot defense consistency, we can guess that player rim defense also has a high consistency. This is proven by year-to-year correlations of player rim field goal percentage allowed, though, as r = 0.453 for players who stay on the same team and r = 0.222 for players who switch teams (so the surrounding team does have an impact on a player’s shot defense at the rim, but a player’s rim field goal % allowed still matters). It is important to note that shots at the rim for a player’s defense is defined as a shot that is taken less than 6 feet from the hoop (not necessarily in the restricted area) with the player as the closest defender.
The stats for some of the primary rim protectors this season are shown below.
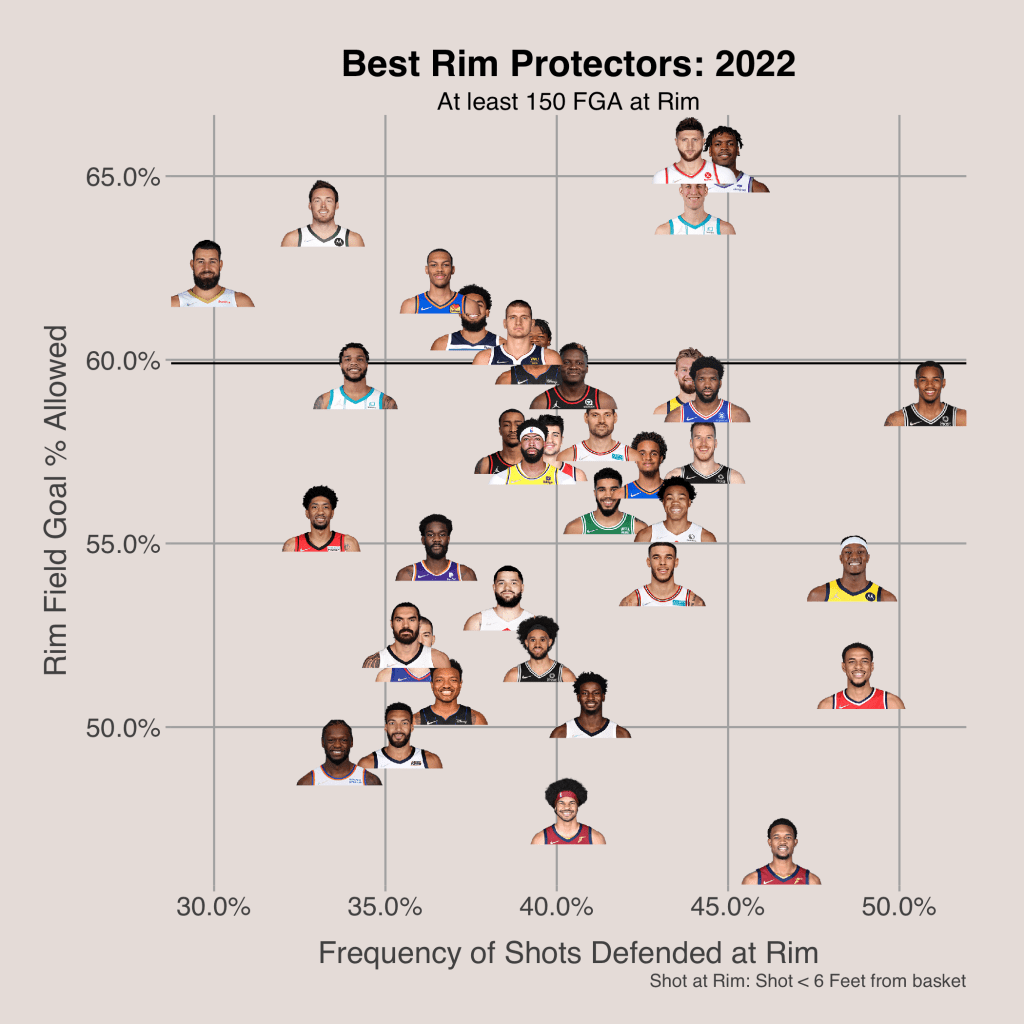
The best rim protectors are located at the bottom of the graph as they allow a low field goal percentage at the rim. Players like Evan Mobley and Jarrett Allen fuel the Cavaliers’ top ranked rim defense, while Julius Randle leads the Knicks’ 2nd ranked rim defense. Giannis Antetokounmpo (not shown on the graph because he has 141 FGA) actually leads the way by allowing just 44% of attempts at the rim to be made.
The rim field goal percentage allowed statistic is very consistent for the top rim protectors. Jarrett Allen has been in the 91st percentile or above since 2020, Giannis has ranked in the 95th percentile or above since 2019 (the earliest year in my sample), 3-time Defensive Player of the Year Rudy Gobert has ranked in at least the 94th percentile since 2019, and even a poor rim protector like Nikola Jokic has ranked between the 40th and 44th percentile since 2020.
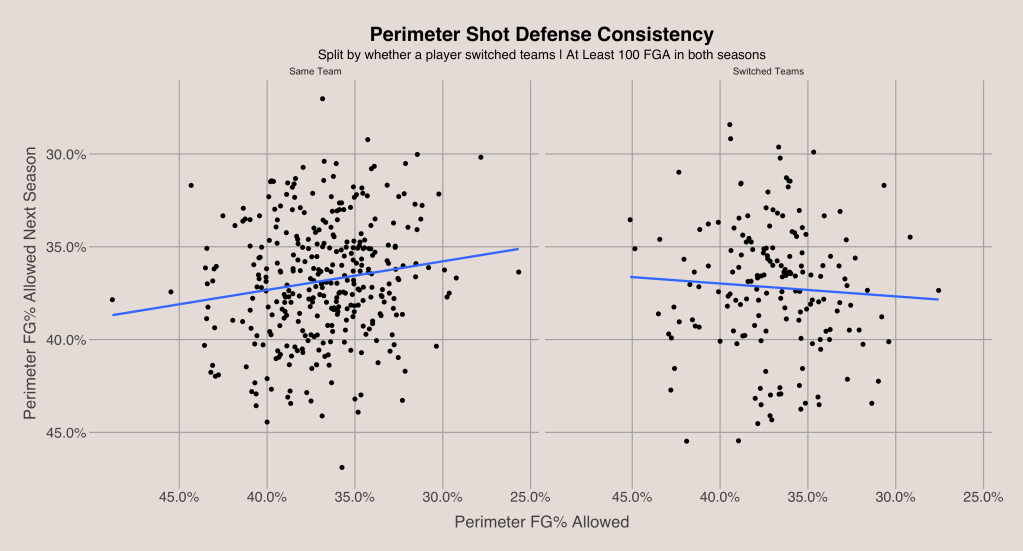
We know that the role of big men in NBA defenses is to protect the rim, making opponents’ shots at the rim less efficient by contesting shots. However, there is also the question of the role of perimeter defenders. The first thought would be that their job is also to force a low field goal percentage on shots they defend, but this is not the case. Opponent field goal percentage on the perimeter (shots 15+ feet away from the rim) is very inconsistent for players from year-to-year, with r = 0.152 for players who tay on the same team and r = -0.061 for those who switch teams. Opponent field goal percentage on the perimeter is significantly affected by random chance.
Since randomness plays a large role in opponent perimeter shooting, the role of perimeter defenders shifts to something else. First, they should try to force opponents to take shots from mid-range as opposed to shots at the rim or wide-open 3’s. Perimeter defenders should be sure to stay in front of their man and play strong defense on drives and contest 3-point attempts. Second, perimeter defenders should try to force turnovers and disrupt their opponent’s offense. After shot defense, the second most important element of defense is forcing turnovers, and perimeter defenders can do this by getting their hands in passing lanes or picking the pockets of ball handlers.
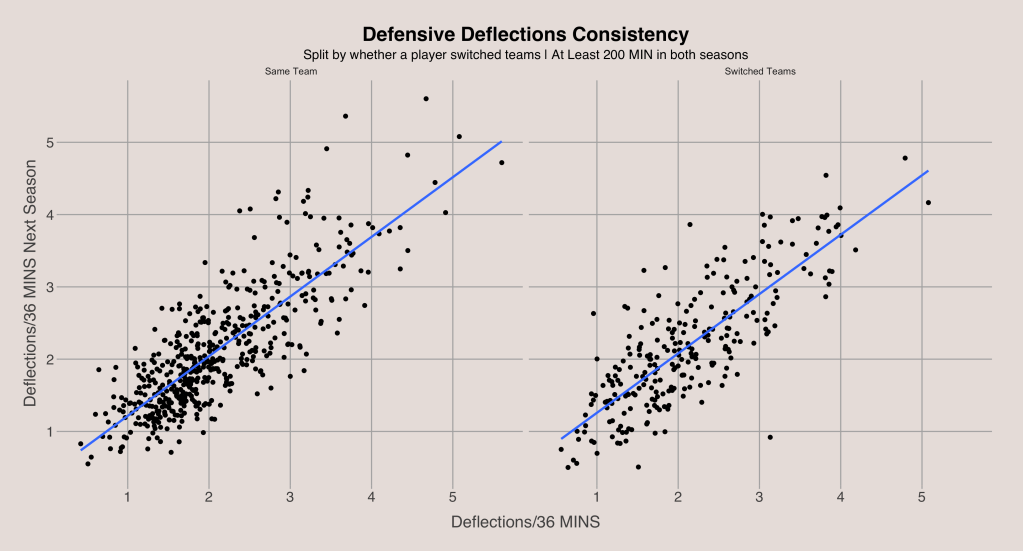
While steals are a great measure of the ability of a player to force turnovers, deflections are a better one. A deflection is when a defender hits a part of the basketball on defense. Therefore, deflections include plays where a defender knocks the ball away, but isn’t quite able to recover it. These deflections that don’t produce turnovers still provide some hidden value, as it is difficult for an offense to gather itself with little time remaining after it has been disrupted by a deflection. Even more evidence for the skill of deflections is the year-to-year consistency in deflections per 36 minutes. The correlation is 0.815 for players who stay on the same team and 0.808 for those who switch teams, so the skill of deflections is entirely independent of the team a player is on.
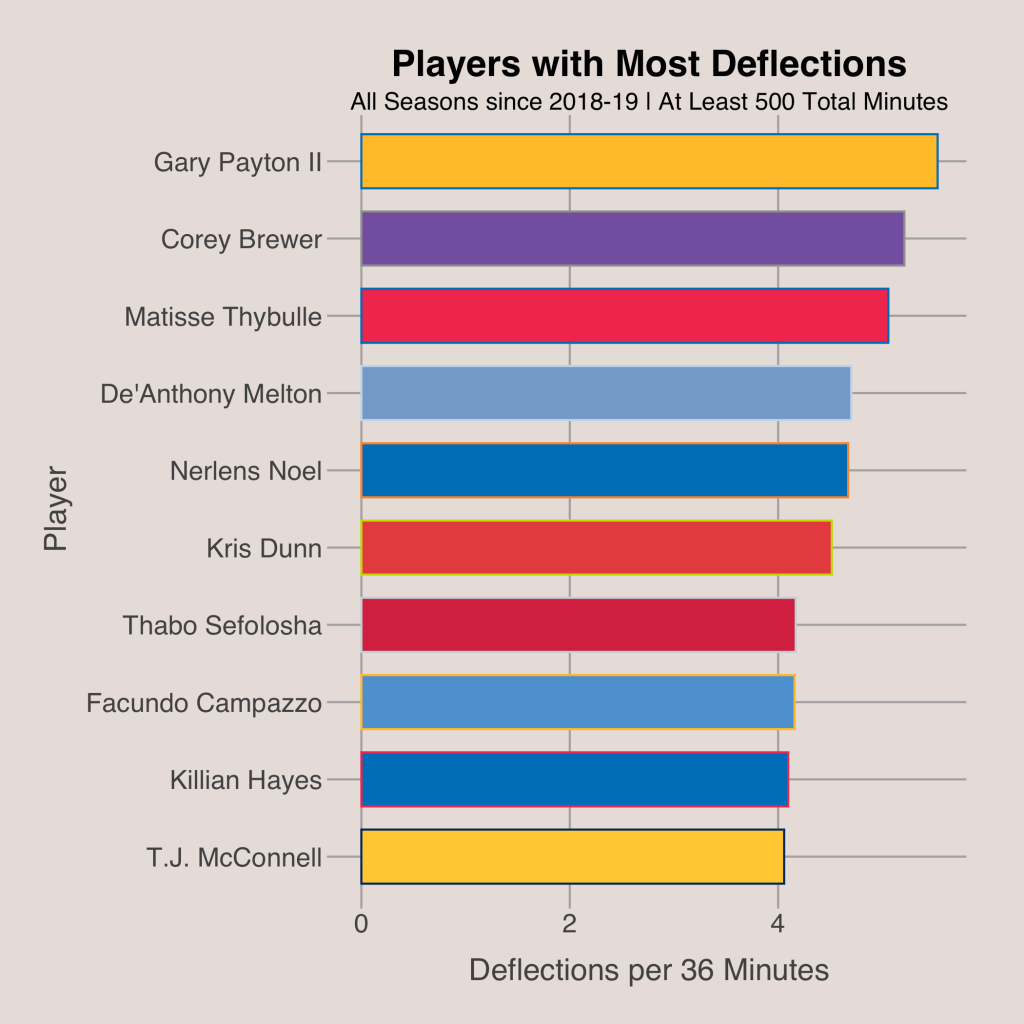
The players with the most deflections per 36 minutes this season include Gary Payton II, Matisse Thybulle, De’Anthony Melton, and Alex Caruso. All of the guards who have made NBA All-Defensive Teams in recent years, such as Jrue Holiday, Ben Simmons, Matisse Thybulle, Jimmy Butler, and Marcus Smart, consistently rank above the 90th percentile in deflections per 36 minutes.
Summary
NBA defenses should be built around a strong rim protector. The consistency of opponent efficiency at the rim is far greater than the consistency of opponent efficiency from mid-range or from three, so teams should try to have a strong presence who can block shots and force more misses at the rim. Teams should worry less about opponents’ efficiency from three since it is primarily a product of luck. Additionally, teams can improve their defense by forcing lots of mid-range shots since those have the lowest efficiency. Teams have some control over opponent shot tendencies, so they should force opponents to take shots between the restricted area and the 3-point line.
While the role of bigs in a defense is to protect the rim, the role of perimeter defenders is to try to force mid-range shots and disrupt the offense by deflecting the ball. Therefore, teams should look for players who have a high number of deflections per 36 minutes to improve their perimeter defense. NBA defenses can be successful by having great rim protectors, forcing mid-range shots, and deflecting the ball often.
Related Posts:

Interesting
LikeLike