

Defense is a difficult element of basketball to quantify. Traditional box score statistics like steals, blocks, and defensive rebounds are helpful, but they don’t help fans understand which players are effective on-ball stoppers. After all, most steals and blocks are gotten while playing off-ball defense. Opponent shot tracking has helped to determine which players are best at forcing bad shots, but these stats are often very inconsistent and therefore are often subpar indicators of true defensive ability.
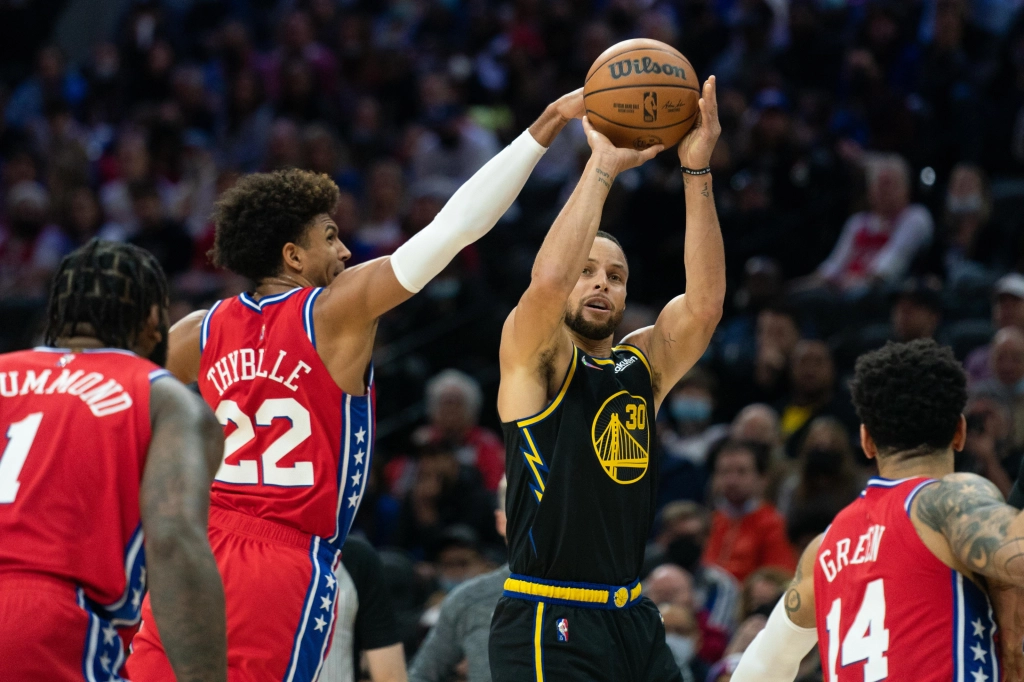
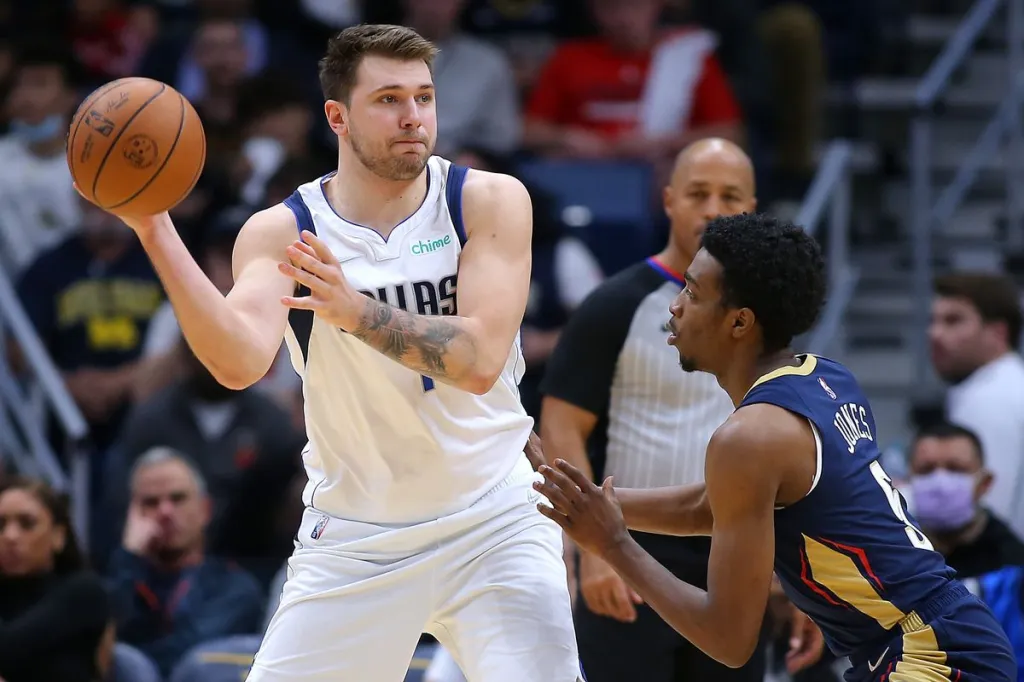
One way to get a better understanding of which defenders are the best are to see which defenders are tasked with stopping the best offensive scorers. In other words, defensive matchup difficulty is a critical element in finding out which defenders are required to face offensive superstars like Steph Curry and Luka Doncic day in and day out.
Defensive Matchup Difficulty: How Its Calculated
It is obvious that NBA teams will attempt to put their best defender on opposing scorers to limit them. Therefore, the best defenders will have the most difficult matchups.
To calculate defensive matchup difficulty, I looked at NBA matchup data provided by NBA.com. This data displays the number of possession an offensive player faced a defensive player, and it also shows how much they scored, shot, turned the ball over, etc while being guarded by the defensive player. I calculated defensive matchup difficulty by taking the weighted average of each defensive player’s matchups’ season points per 100 possessions. I used points per 100 possessions because it helps to adjust for playing time and pace while capturing scoring ability. To get a better idea of the process, I will explain a a simplified example.
Let’s say we want to calculate the defensive matchup difficulty for Bob. Let’s say Bob was matched up against Jack for 40 possessions, against Sam for 30 possessions, and against James for 20 possessions. If Jack has scored 35 points per 100 possessions during the season, Sam has scored 25 points per 100 possessions, and James has scored 45 points per 100 possessions, then Bob’s defensive matchup difficulty is the weighted average of the opposing player’s points per 100 possessions, which is (40 * 35 + 30 * 25 + 20 * 45) / (40 + 30 + 20) = 33.9 points per 100. This means that on average, Bob is matched up against a player that scores 33.9 points per 100 possessions.
Applying this process to all NBA players that played at least 1000 minutes this season can show us which players have the most difficult matchups and the easiest matchups, on average. The distribution of defensive matchup difficulty is shown below. The distribution peaks at about 23 points per 100 possessions, meaning that on average, a defender is matched up with a player that scores 23 points per 100 possessions. We can also tell that the defenders with the most difficult matchups usually have a defensive matchup difficulty above about 24, while the defenders with the easiest matchups have a defensive matchup difficulty under about 21.

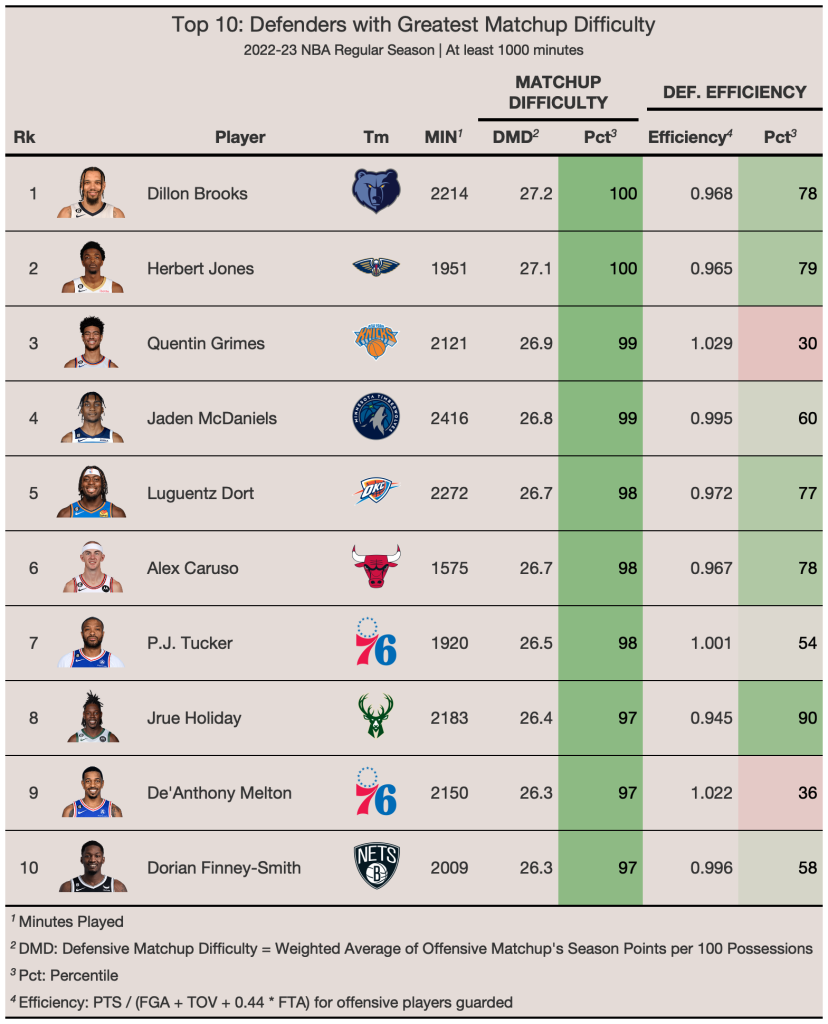
So which defenders actually had the most difficult matchups? The table below shows the top 10 qualifying players ranked by defensive matchup difficulty (abbreviated DMD in the table). Dillon Brooks leads the NBA in matchup difficulty, facing off against players that score 27.2 points per 100 possessions, on average. He is followed by Herb Jones, Quentin Grimes, Jaden McDaniels, and Alex Caruso in the top 5. All the defenders in the table are generally regarded as great defenders, so it looks like matchup difficulty is a good tool to recognize high-level defenders.
The table also includes the defensive efficiency of these players. The defensive efficiency is calculated using the following formula: PTS / (FGA + 0.44 * FTA + TOV), where PTS is points, FGA is field goal attempts, FTA is free throw attempts, and TOV is turnovers. This represents the average points per player possession the opponent scores against the defender. A lower value is better since that means the defender is holding the offensive player to a lower efficiency. The fact that some highly regarded defenders like Jaden McDaniels and PJ Tucker don’t have great defensive efficiencies indicate that it is probably better to use matchup difficulty to evaluate them.
It is important to recognize some things that defensive matchup difficulty does not account for. For example, mismatch hunting is a common tactic in the NBA, which is a strategy in which an offense forces the defense’s worst defender into a ballscreen and allows someone to score in isolation against the opponent’s weakest defensive link. In addition, teams with a switch heavy defensive scheme are less likely to produce players with high defensive matchup difficulty since players will likely switch most screens. It also cannot account for some defensive roles that do not rely on stopping a single player, such as the job of rim protectors (which I elaborate on later). Nonetheless, the best defenders tend to have the most difficult matchups so it is still a great tool.
Consistency
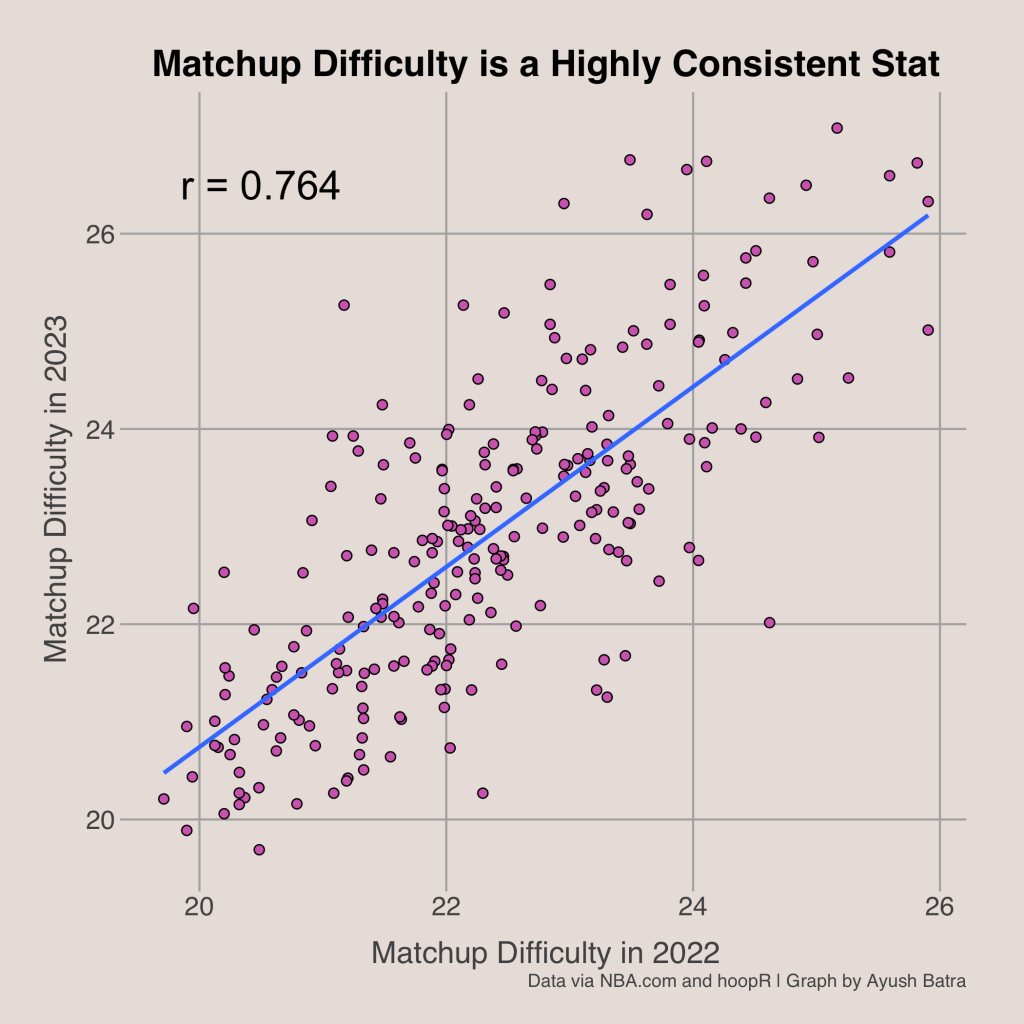
An important element of what makes a statistic reliable in sports is its consistency. A consistent statistic will consistently place the same players among the top, while inconsistent stats are very random and sometimes have odd results. A common to measure the consistency of a stat is to see its year to year correlation. Using defensive matchup difficulties from 2022 and 2023, we can see that defensive matchup difficulty is pretty consistent from year to year with a correlation coefficient of 0.764, which is pretty high for a basketball statistic (for comparison, the correlation of team wins from year to year is about 0.64). This consistency is not surprisingly considering teams will likely choose the same players to defend the best offensive scorers each year.
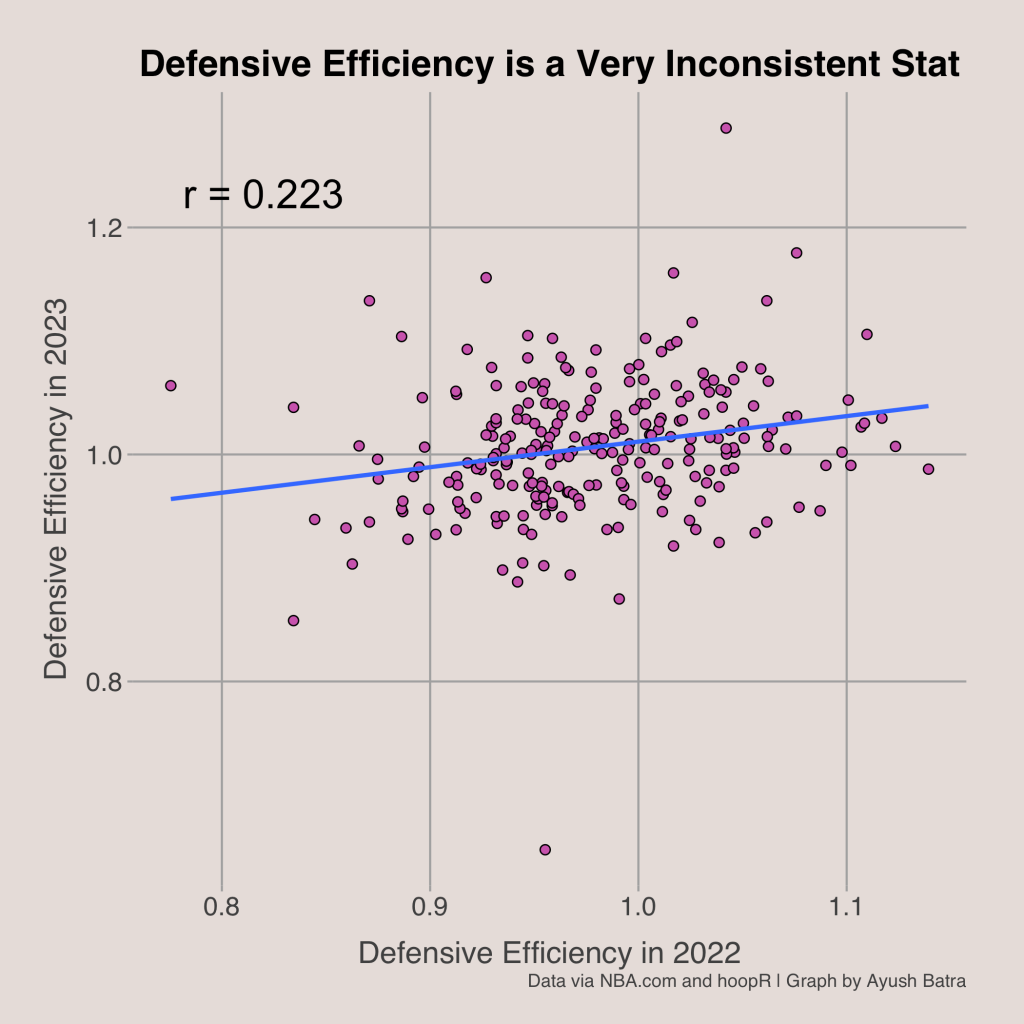
Is defensive efficiency consistent, though? We can use the same process to see if defensive efficiency tends to rank the same players highly each year or if it is heavily impacted by noise. As seen below, there is a pretty weak relationship from year to year for defensive efficiency, so it is less reliable. Opponent shooting efficiencies can be helpful in measuring defensive impact, but it is important to have a very large sample because there is a lot of noise involved. For example, Rui Hachimura and Devonte’ Graham were among the top 20 in defensive efficiency. Although these guys are solid NBA players, I think most would peg them as below-average defenders at best. In summary, its probably not a good idea to use just defensive efficiency to measure player defense unless you have a really large sample (like several years). From this, it seems like defensive matchup difficulty is a better way to measure defensive ability than defensive efficiency.
Defensive Matchup Difficulty and Steals
The next thing I wanted to explore is how defensive matchup difficulty relates with some other important defensive stats. The first relationship I looked at was the relationship between defensive matchup difficulty and steals. The graph below plots defensive matchup difficulty against steals (per 48 minutes).
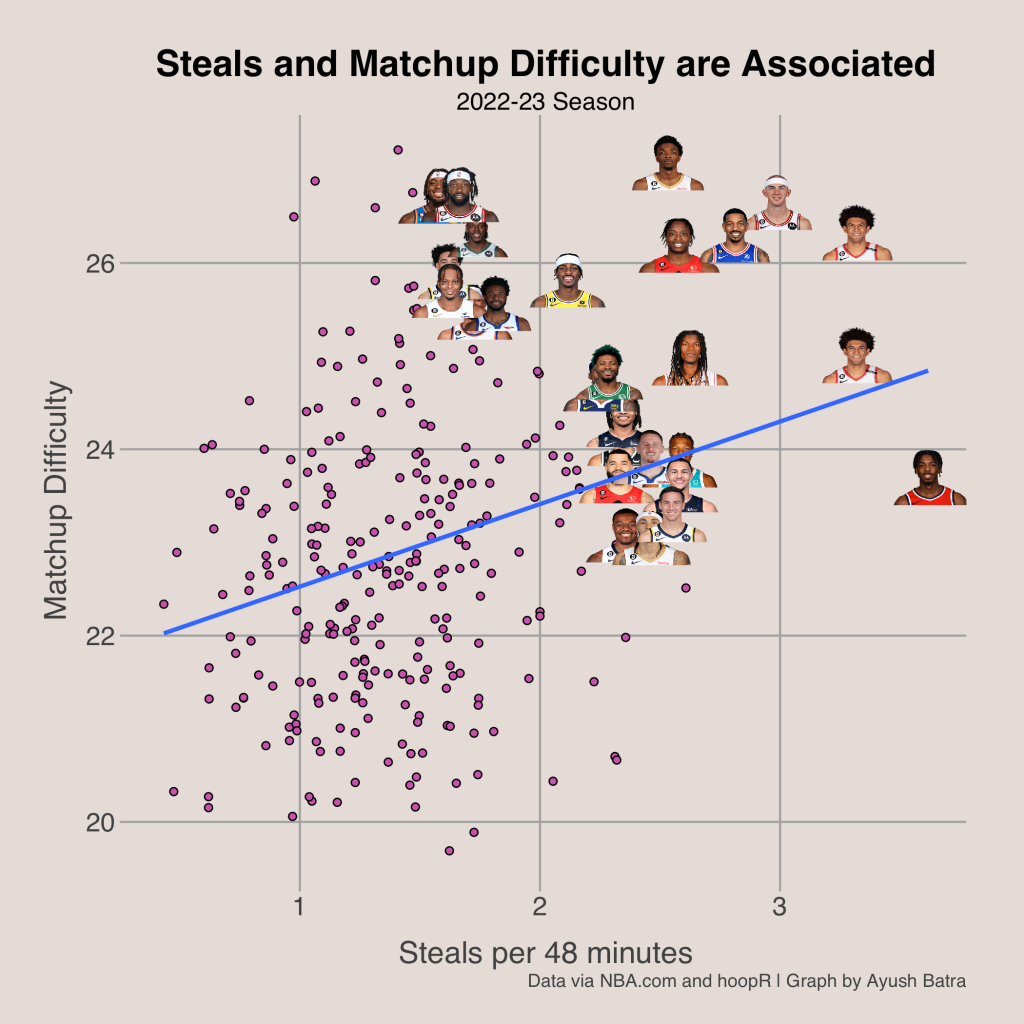
The line of best fit in this graph has a pretty obviously positive slope. This means that players with more steals tend to have a greater defensive matchup difficulty. I find this interesting because steals are a better representation of off-ball defense rather than on-ball defense. Most steals are acquired by getting hands in passing lanes, although some steals come on-ball as defenders poke the ball away from the ball handler.
The positive relationship signifies there is some driving factor that causes certain players to get lots of steals and have the ability to defend the best scorers. Although the driving factor is not known, I think that a combination of defensive awareness, quickness, instincts, and wingspan could be possible reasons that guys like Matisse Thybulle, Alex Caruso, and De’Anthony Melton are great at getting steals and also have the skill to defend great scorers, making them high impact defenders.
Matchup Difficulty for Rim Protectors
Next, I looked at the relationship between matchup difficulty and shots blocked. As seen below, this relationship is not nearly as strong as the one between matchup difficulty and steals.
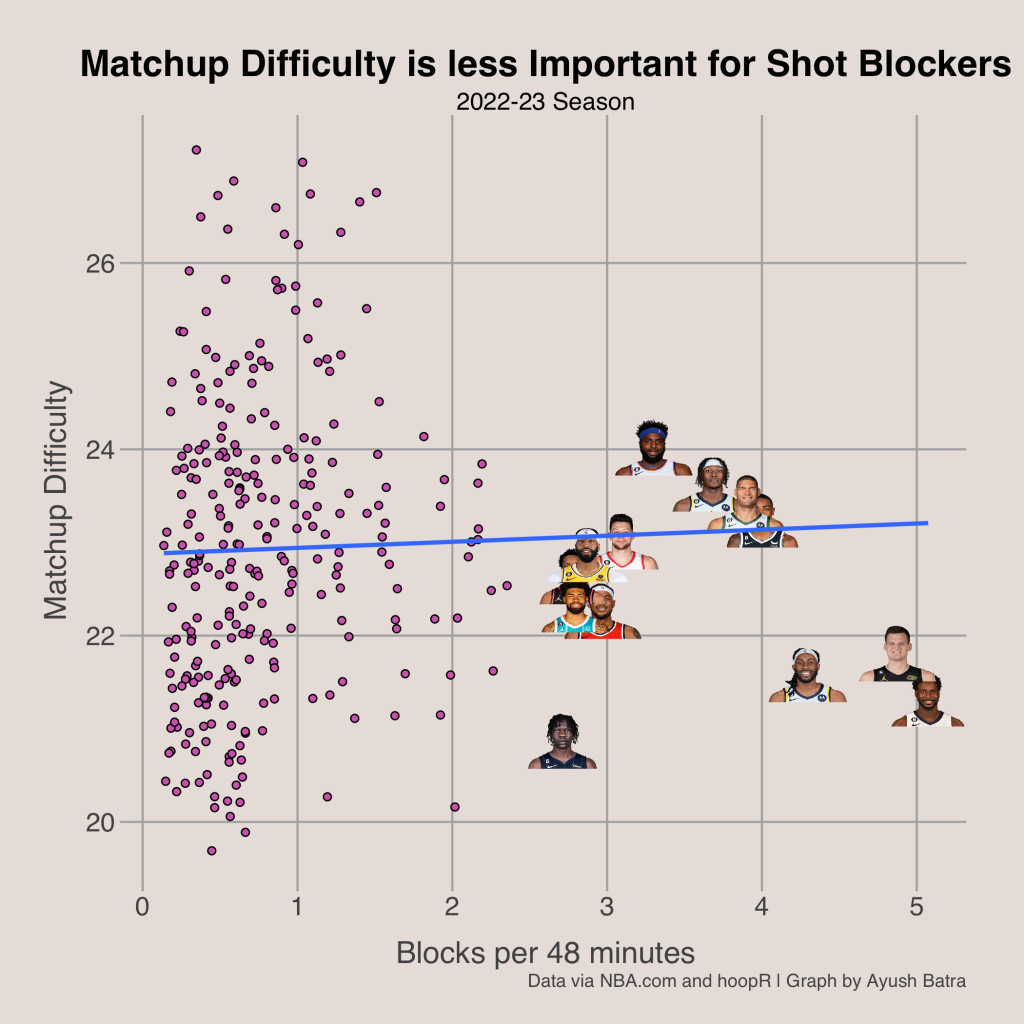
The best fit line in the graph above is nearly horizontal, hinting that there is essentially no relationship between matchup difficulty and shots blocked. At first glance, this does actually make sense. The players that block a lot of shots are usually playing defense near the rim. Therefore, they are often matched up against a wide variety of players instead of sticking to defending just one guy, effectively limiting the ceiling of their matchup difficulty. As shown below, players that block a lot of shots have an upper bound of matchup difficulty that is pretty low when compared to all defenders. In fact, there are almost no primary shot blockers that have a defensive matchup difficulty above 24 points, while many non-shot blockers are able to cross this threshold.

The fact that shot blockers have a limited ceiling for defensive matchup difficulty tells us that defensive matchup difficulty is not really an important part of what makes shot blockers valuable. Rim protectors are arguably the most important part of a good defense because they are simply good at limiting opponent efficiency at the rim. It doesn’t really matter who they are matched up on because their job is to provide help and make shots at the rim as tough as possible, no matter who is shooting. Brook Lopez, Jaren Jackson Jr., and Walker Kessler are just a few examples of outstanding defensive anchors that make scoring so difficult because their shot blocking and shot altering ability at the rim is so good.
Additionally, a common strategy in the NBA is to put a rim defender on a weak shooter on the perimeter. The Celtics did this with Rob Williams last season a lot, and this season Jaren Jackson Jr. is often put on poor corner shooters. The reason NBA defenses apply this tactic is because then these defenders can easily help off their guy and provide help at the rim. It is not a big deal if they leave the person they are originally guarding because the originally guarded players are usually poor scorers. Basically, defensive matchup difficulty is not really relevant for rim protectors because their job is to limit opponent efficiency at the rim, not to guard opposing star players all over the court. In contrast, the main job of the wing defenders that ranked so highly in defensive matchup difficulty was to guard opposing scorers all over the court.

The Impact of Great Defenders
The last thing I explored is how the defenders with the highest degree of matchup difficulty impacted the opponents’ offense. First, I will define some of the terms I will use to make this easier to explain:
- A Scorer is a player that ranked in the top 50 of points per 100 possessions among qualifying players (above 1000 minutes)
- A Non-Scorer is a player that ranked outside of the top 50 in points per 100 possessions
- A Stopper is a player that ranked in the top 50 of defensive matchup difficulty among qualifying players
- A Non-Stopper is a layer that ranked outside of the top 50 in defensive matchup difficulty
Basically, scorers include all-star level offensive talents like Embiid, Giannis, Luka, Lillard, and others, while stoppers include players such as Dillon Brooks, Herb Jones, and Jaden McDaniels (and more) that are tasked with guarding the best scorers.
The question I wanted to answer is this: Do scorers have a lower usage or efficiency when they are matched up against stoppers?
First, I looked at how these matchup pairings impacted offensive player usage. In this context, offensive player usage is measured by the proportion of possessions guarded that the offensive player either shot, turned the ball over, or got to the free throw line. For example, if Player A guarded Player B for 50 possessions, and in those possessions player B had 5 field goal attempts and 2 turnovers, then the usage in this scenario would be (5 + 2) / 50 = 14%.
I split all the player matchups from the 2022-23 NBA season into 4 categories:
- 1. Scorer guarded by Stopper
- 2. Scorer guarded by Non-Stopper
- 3. Non-Scorer guarded by Stopper
- 4. Non-Scorer guarded by Non-Stopper
The results for offensive player usage rates split by these four categories are shown below.

There are several takeaways from this graph. First, we can look at the Non-Scorer offensive category. Non-Scorers have a very similar usage (about 21-22%) whether they are guarded by a stopper or a non-stopper. However, the same is not true for Scorers. Scorers have a much lower usage when they are being guarded by a Stopper. This change is pretty big, too, as Scorers have a usage close to 40% when bing guarded by Non-Stoppers, while their usage is lower than 30% when guarded by a Stopper.
So what does this all mean?
First, it looks like Stoppers are making the biggest impact when they are guarding Scorers. By decreasing the usage rate for Scorers, the defense is forcing players that don’t usually score as much to try to score more often. In essence, the best defenders do a great job of limiting the scoring attempts of high-scoring offensive players. Therefore, defensive Stoppers like Dillon Brooks and Herb Jones are making the biggest impact when they are guarding offensive Scorers like Luka Doncic or Damian Lillard.
However, Stoppers don’t just limit usage. In fact, they also limit the offensive efficiency of Scorers. The graph below displays the offensive efficiency of Scorers and Non-Scorers split by whether they are defended by a Stopper or Non-Stopper. The offensive efficiency is calculated by (Points) / ( (Field Goal Attempts) + 0.44 * (Free Throw Attempts) + (Turnovers) ). In order to make these changes easier to see, the y-axis displays the offensive efficiency above league average. These values may look small, but in reality there are over 110 possessions per game (when calculated this way), so a difference of 0.04 can mean over 4 points over the course of a game. For comparison, the difference in the point differential per game between the Suns and the Magic was just 4.5 points. In addition, I added error bars that display a 99% confidence interval for the true value of each category.
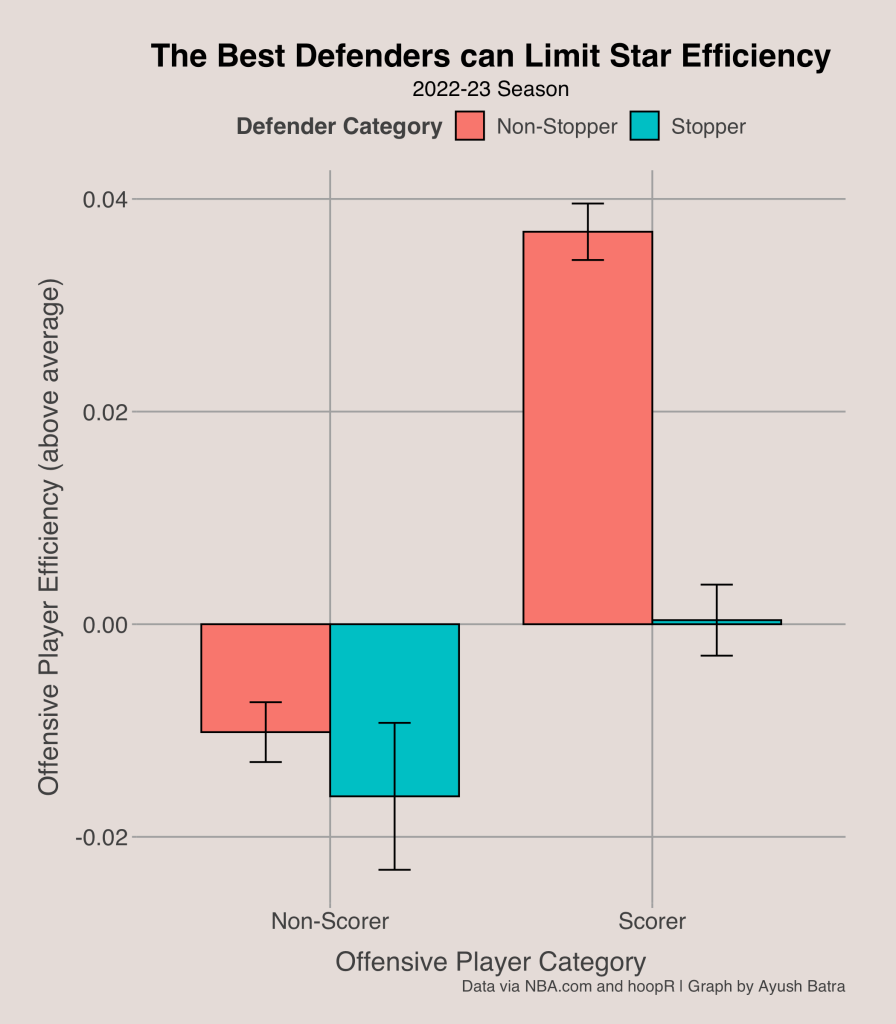
When looking at Non-Scorers, there does not appear to be a significant difference between offensive efficiency based on whether the defender is a Stopper or a Non-Stopper because the error bars have a big overlap. However, there is a stark difference for Scorers. When a Scorer is guarded by a Non-Stopper, the average offensive efficiency is about 0.04 points above average (again, this is about 4 points over the course of an entire game). However, Scorers have just a league average efficiency when being guarded by Stoppers.
This tells us that defensive Stoppers have a real tangible impact on the game. The players with the highest matchup difficulty are also those who are best at limiting the production of the best offensive scorers. Therefore, we can infer that players with high matchup difficulty are indeed great defenders since Scorers have a lower usage and worse efficiency against Stoppers. In addition, we can be sure that small sample sizes are not an issue since there are tens of thousands of possessions for each category, so the extreme differences in Scorers’ production when defended by a Stopper vs a Non-Stopper is very unlikely to occur just by random chance alone.
If you are interested, here are the top 2 players in defensive matchup difficulty for every team in the 2023 NBA Playoffs.


Conclusion
We can measure defensive matchup difficulty by taking the weighted average of opponent points scored per 100 possessions, with the weights coming from the number of possessions matched up against a certain offensive player. Defensive matchup difficulty turns out to be a very consistent stat, so players that rank high in matchup difficulty in one year are likely to rank highly again in the next year.
Additionally, it was seen that matchup difficulty has a positive association with steals, so players with lots of steals tend to have a higher defensive matchup difficulty. However, matchup difficulty is not really applicable for big men whose main role is to protect the rim since they are not concerned with stopping a certain offensive player all over the court; instead, they tend to linger near the rim to deter and block shots.
Lastly, it was seen that players with a high defensive matchup difficulty do a great job of limiting high-scoring players’ usage and efficiency. A big takeaway is that high-scoring players’ usage falls from about 40% to under 30% when guarded by high matchup difficulty defenders, and their efficiency falls from 0.04 points per possession above average to about league average when guarded by high matchup difficulty defenders. The fact that high-scoring players are unable to sustain high usage rates and have lower efficiency against players with high defensive matchup difficulty indicates that defensive matchup difficulty does a good job of indicating defensive performance. Watch out for players with high defensive matchup difficulty like Dillon Brooks, Herb Jones, and Quentin Grimes to limit some of the offensive stars in the Playoffs!
See the code used to make these visualizations and stats here: https://github.com/AyushBatra15/Matchup-Difficulty
Related Posts:
- Optimal NBA Team with Genetic Algorithms
- Mapping NBA Futures: Simulating Career Trajectories with WAR Projections
- Predicting Future Performance: The Best Shot Creators, Shooters, and Defenders in the 2024 NBA Draft
- Projecting Future All-Stars in the 2024 NBA Draft
- 2024 March Madness Predictions: Which Teams are Over and Under-seeded

3 thoughts on “Defensive Matchup Difficulty: Which NBA Players Face Off Against the Best?”