
The NBA Playoffs are the biggest part of the NBA calendar. The playoffs are where legacies are made for players, coaches, and even entire franchises. Most NBA fans have an idea of what teams are best suited for the playoffs: teams with lots of star players and experience making deep runs in the playoffs. Interestingly, this is often at odds with the regular season results as the teams with the best pre-playoffs odds of winning the NBA Finals are not always the best regular season teams. For example, the Western conference 1 seed and eventual NBA Champions Denver Nuggets were 6th in championship odds before the playoffs began, according to DraftKings. Meanwhile, the 4 seeded Suns and the 6th seeded Warriors had better championship odds, while the 7th seeded Lakers were right behind the Nuggets. Even further, teams like the Cavs and Grizzlies didn’t have good championship odds (9th best and 8th best, respectively) despite ranking in the top 5 of net rating (a good measure of team strength) through the regular season. We see similar examples looking at the 2022 pre-playoffs championship odds, as the Jazz, Grizzlies, and Mavericks had odds that did not line up with their regular season performances. This trend has been amplified in recent years, likely due to an increase in load management as the best teams choose not to play their best players in all their games, so their regular season results may not reflect the true strength of the team. Because of this, we need to consider factors outside of regular season performance, such as how good the best players of the team are and how much playoff experience they have, when predicting playoff results.

Predictors
The goal of this project was to try and predict the winning team in a given playoff series based on just a few simple factors: regular season performance (as measured by net rating), player talent (measured by All-NBA shares), and playoff experience. More specifically, we are predicting whether the higher-seeded team (the team with home-court advantage) wins or loses the series. If the teams in the series have the same seed (which may be the case in a Finals matchup), then the higher-seeded team is considered to be the team with home-court advantage. Therefore, all references to wins or losses in any graphics or explanations will be in the perspective of the higher-seeded team: win means the higher seeded-team won the series, while loss means the lower-seeded team won the series.
We can start by getting an idea of how often the higher-seeded team wins playoff series in general. I used NBA playoff series from 2011 to 2023 to create the sample, so there were a total of 195 series in sample. Within the sample, 142 of the 195 (73%) higher-seeded teams won their series. This is a good baseline, but including more information will give much better predictions.

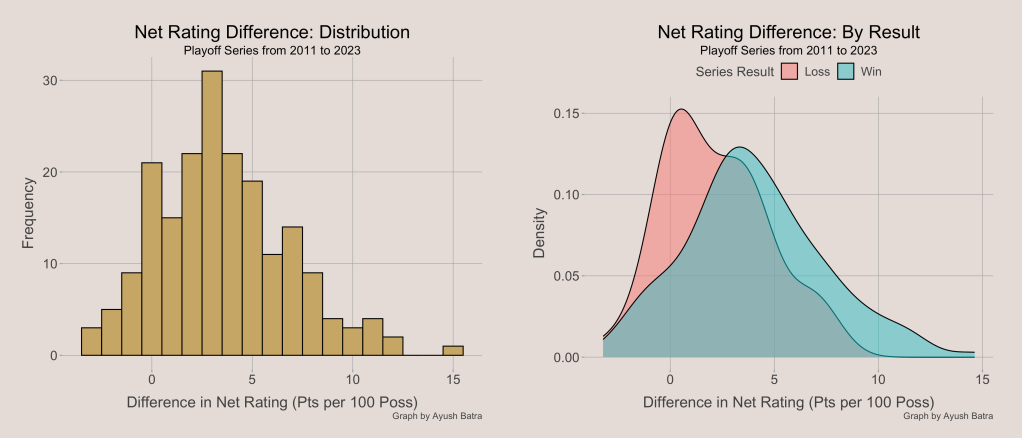
The first thing to consider is regular season performance. The best way to do that, in my opinion, was to use net rating. A team’s net rating is simply its point differential per 100 possessions. A good, simple way to measure how much better the higher-seeded team is than the lower-seeded team is to take the difference in their net ratings. The distribution of the difference in net ratings is shown below. We can see that most higher-seeded teams are better than their opponents by between 1 and 6 points per 100 possessions. However, there have been several cases where the higher-seeded team was actually worse per-possession than the lower-seeded team. Looking at the net rating difference distribution by series result can tell us how the net rating difference may impact which team wins. As expected, it appears that higher-seeded teams that lose the series often have a lower net rating difference than higher-seeded teams that win their series, which means that the higher-seeded teams that lose tend to be closer to their opponents’ level.
Now, let’s consider player talent. This is very difficult to measure, as much of basketball analytics is devoted to player evaluation and impact alone. To make this easier, I decided to use All-NBA voting shares as a proxy for “talent.” The way the All-NBA voting works is that players receive 5 points for a first-team vote, 3 points for a second-team vote, and 1 point for a third-team vote (there are 100 voters in total). The All-NBA voting share for a player is just the proportion of possible points received, or the actual number of points received divided by the total number of possible points. Therefore, a player’s All-NBA voting share ranges between 0 and 1. Of course, All-NBA voting isn’t perfect as voters sometimes have weird selections and the position rules can cause a player to receive fewer shares than he may deserve, but its good enough.
To get an idea of team strength, I took the sum of the All-NBA voting shares for all players on that team. The distribution of team total All-NBA shares can be seen below. Most teams have a total All-NBA share less than or close to 1. This makes sense because there are only 15 players that make an All-NBA team, so there aren’t many shares to go around. However, some stellar teams have had a total All-NBA shares well over 1, meaning they had 2 or more players in serious contention for an All-NBA team. Examples of these teams include the 2016 Warriors (Curry, Draymond, Thompson), 2020 Lakers (LeBron and Anthony Davis), 2019 Warriors (Curry, Durant, Thompson), 2016 Thunder (Durant and Westbrook), and the 2011 Heat (LeBron and Wade). In addition, we can see that higher-seeded teams that win their playoff series tend to have a greater difference in All-NBA shares than higher-seeded teams that lose their playoff series. The outlier point for the team that won their playoff series despite their opponent having a much higher total All-NBA shares was the 2019 Toronto Raptors in their finals matchup against the Warriors.

The final variable that I want to explore is playoff experience. I calculated the playoff experience for a given team as the average of the playoff minutes played by each player prior to the given year’s playoffs, weighted by the player’s minutes per game in the given regular season (among players that played enough). The distribution of the playoff experience of playoff teams is shown below. There is a noticeable skew in the distribution towards the right as most teams tend to have a weighted playoff experience between about 200 minutes and 2000 minutes, but there are a few teams that have had a weighted playoff experience over 3000 minutes. The impact of playoff experience on series results is noticeable as well. In the figure below on the right, we see how often the higher-seeded team won the series for various levels of playoff experience disparities. Specifically, the x-axis plots the difference in the log of playoff experience in order to account for the fact that the distribution of playoff experience is heavily skewed. The important takeaway is the clear positive trend between playoff experience difference and series winning percentage, showing that more playoff experience is related to winning series more often.

Modeling
We know that regular season performance, player talent, and playoff experience are all associated with better playoff results. However, we must untangle the 3 since looking at each one along ignores the fact that they are all related to each other. After all, we would expect teams with lots of player talent and lots of previous playoff experience to be good in the regular season. To separate these impacts, I used multivariable logistic regression to predict the playoff series result using regular season performance, player talent, and playoff experience of the teams involved. The final model for the log-odds of the higher-seeded team winning the series is shown below:

There are many takeaways from the model output. Primarily, the p-values of the predictors indicate that playoff experience and player talent are more important factors in determining the outcome of a playoff series than regular season performance. For every 1 point increase in regular season net rating differential (higher-seeded net rating minus lower-seeded net rating; represented as NRTG_diff in the table), we would expect the odds of the higher-seeded team winning the series to increase only by about 13%, holding total All-NBA voting shares and playoff experience constant. For every 1 All-NBA voting share increase in total All-NBA voting shares differential (shares_diff), we expect the odds of the higher-seeded team winning to increase by about 117%, holding net rating and playoff experience constant. In fact, using the model, a single player with an All-NBA voting share of 1 (aka a consensus first team All-NBA player) is worth just over 6 points of net rating! That’s a massive impact that just one player can make!
The experience term is more difficult to analyze, but this is the interpretation: When the ratio of playoff experience of the higher-seeded team to the lower-seeded team doubles, we expect the odds of the higher-seeded team winning to increase by about 37%, holding all else constant. Lastly, the intercept tells us that a team that is playing a playoff series against an opponent with an identical regular season net rating, total All-NBA voting shares, and playoff experience but has home court advantage is expected to win the series about 60% of time time.

Performance
To assess the performance of the model, I applied it to a testing set that included 39 playoff series. The accuracy of the model (using a cutoff probability of 75%) is 74%. I chose 75% as the cutoff probability because 1) 50% was too low as only 1 test set prediction had a predicted probability below 50%, and 2) 73% was the baseline win percentage for higher-seeded teams, so we are kind of seeing if the prediction expects the higher-seeded team to win more than the typical higher-seeded team or not. The precision of the model on the test set is 81.5%, meaning that 81.5% of the series that were predicted to be won were actually won by the higher-seeded team. A more wholistic assessment of the model’s performance can be done by examining the area under the ROC curve. The test set had an AUC of 0.778, which is not bad considering the unpredictable nature of sports. The test set performance was actually better than the training performance, so it is unlikely that the model is overfit.

Predictions for 2024
Note: all stats in this section are as of the All-Star Break of the 2023-24 season; the playoff experience calculations do not take into account some players that were traded at the trade deadline since they have not yet played 5 games with their new teams
The exciting part of the playoff model is that we can use it to think about which teams are best suited for the playoff this season. As we saw previously, playoff experience, and player talent are important predictors of success in playoff series. You can see which teams benefit from both high player talent and lots of playoff experience below. The Bucks, 76ers, Nuggets, Mavericks, Celtics, and Lakers are teams that have both great players and lots of experience in the playoffs. The Thunder have a great player in Shai Gilgeous-Alexander, though they have almost no playoff experience. On the other hand, teams like the Warriors, Clippers, and Heat have playoff experience but are unlikely to have an All-NBA player (according to the model; I know that Curry and Leonard have a real chance) this season. The Magic stand out as the team with essentially no major playoff experience or All-NBA level players.

Another way to look at the teams best suited for the playoffs is to see how they would be projected to do against the average playoff team this year. Below, you can see what the current win probability would be for each team as the higher-seeded team against the average playoff team from this year.

Teams below the dotted line are expected to perform worse in the playoffs than you would expect from their regular season performance due to a lack of playoff experience or All-NBA caliber players. The opposite is true for teams above the dotted line. The teams towards the top are most likely to win a playoff series against the average team. From this, we see the model tells us that the Celtics, Bucks, Clippers, 76ers, and Nuggets are the major contenders for an NBA title this season. If the season ended today, this model would predict that the Celtics will beat the Clippers in the 2024 NBA Finals. Playoff experience and player talent are critical for postseason success.
See the code to generate the model and figures here: https://github.com/AyushBatra15/NBA-Playoff-Prediction
