
NFL SAFER is my rankings for NFL teams, using drive statistics and accounting for starting and ending field position. I use these rankings to create win probability, projected point spreads, score predictions, playoff probabilities, and game quality rankings.
SAFER stands for Schedule Adjusted Football Efficiency Ratings.
See full SAFER rankings and score predictions here.
Drive Calculations
In order to capture the true ability of offensive and defensive teams, I chose to use drive data. I did not use all drives, though, as I filtered out drives that occurred when the absolute score differential was greater than 16 in the 4th quarter or the absolute score differential was greater than 24 in all other quarters. This filtered out drives that occurred in garbage time. Additionally, I filtered out drives that were less than 4 plays and didn’t gain any yards when they ended the game or the half because these drives are usually when a team is kneeling to bring the game or half to the end.
Once I gathered all the drives together, I needed to create an expected value for each drive based on starting position and an actual value based on ending field position or drive result. Therefore, I turned to expected points. A further explanation of expected points can be found here. The, the “actual value” for a drive was 7 if it ended in a touchdown, but it was equal to the expected points from the ending field position if the drive did not end in a touchdown. The “actual values” for each ending field position if a drive did not end in a touchdown are shown below.

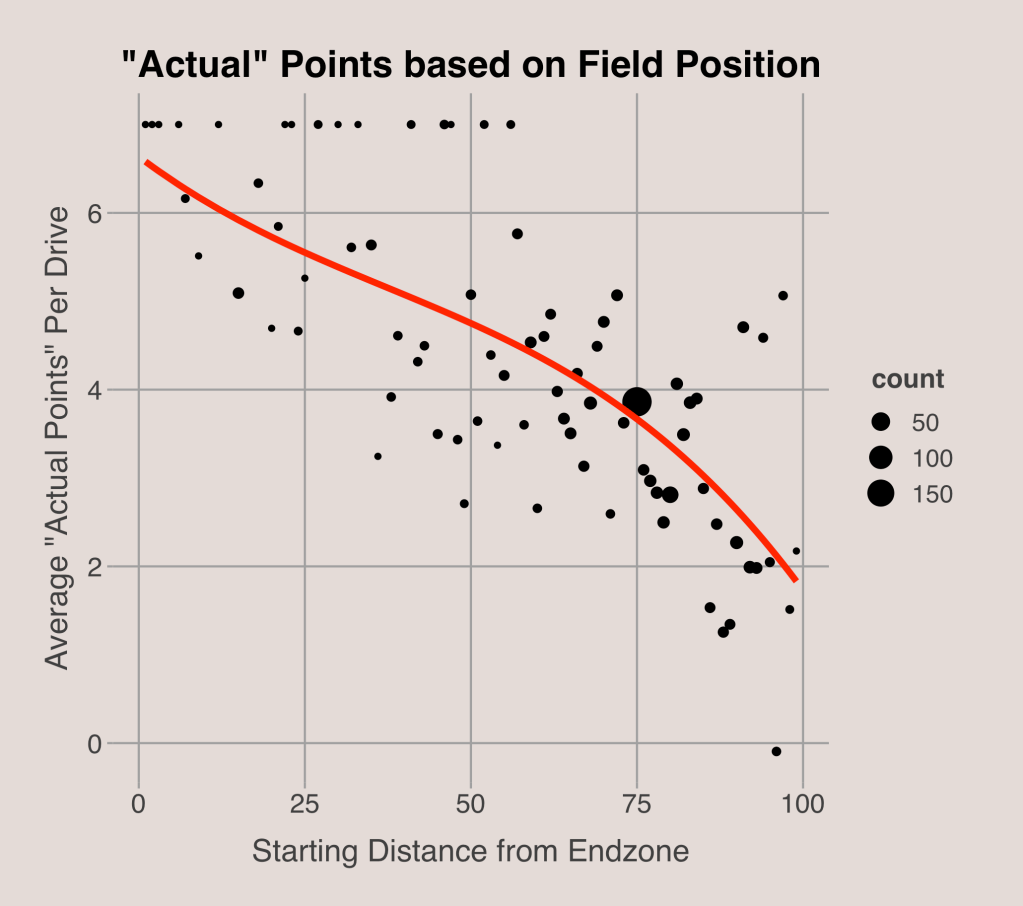
The expected value of a drive, meanwhile, was created using a model to predict actual value (as shown above) based on starting field position alone. The model results are shown below, although the sample only includes drives from the first 2 weeks from the 2021 NFL Season. After applying the results of the regression to the dataset, I had an expected and actual value for each drive, which I then averaged for each team and took the difference to acquire the preliminary unadjusted offensive and defensive ratings. The averages were weighted so that more recent games had a higher weight. I multiplied these ratings by 10 because an average NFL game has around 10 drives for each team, so the numbers could be more easily interpreted.
Next, I had to adjust for schedule. I did this by creating a strength of schedule using each team’s average opponent offensive and defensive ratings. Finally, I acquired the schedule adjusted ratings by adding the offensive rating for a team to their defensive strength of schedule and vice versa. The final steps were to multiply the defensive values by -1 (so that positive ratings indicate good defenses) and to add the offensive and defensive components to form a total rating. I use this total rating to create win probabilities and projected spreads, which I can further utilize to determine playoff probabilities and the best bets against the spread.
Win Probability
To determine win probability of a game, I used each team’s total SAFER rating. I used a logit model using the difference in SAFER ratings and a home field advantage variable to calculate win probability. The formula is:
- Odds = 0.1608 × (SAFER Difference) + 0.07025 × Home
- Win Probability = eOdds / (1 + eOdds)
where the “Home” variable takes on a value of 1 if the team is at home, a value of 0 if the game is at a neutral site, and a value of -1 if the game is on the road.
Projected Point Spread
The Projected Point Spread is calculated by taking the difference in SAFER ratings between 2 teams, multiplying the difference by 1.3, and adding a 0.6 point home field advantage component.
Game Quality Rankings
The Game Quality Ranking is used to determine the combined strength of the teams in a game. First, I take the sum of the total SAFER ratings for both teams in the game. Then, I use a Normal distribution to determine the estimated percentile of the combined SAFER ratings, where the mean of the distribution is 0 and the standard deviation equals the square root of 2 times the variance of the SAFER ratings. [ √(2×(sdTotal2)) ]
The Game Quality rating ranges from 1 to 100.
