

The NBA Finals concluded this past week, with the Los Angeles Lakers taking down the Miami Heat in six games to secure their 17th all time championship, tying them for the most in the NBA with their longtime rivals, the Boston Celtics. The Heat, the surprise team in the playoffs, became the first 5 seed to advance to the NBA finals, entering as underdogs to the Lakers, who were led by LeBron James and Anthony Davis. When it all finished, the Lakers won and LeBron James claimed his fourth Finals MVP award. However, did he deserve this award based on the stats? How well did each player play in the finals?
Using Box Score Stats
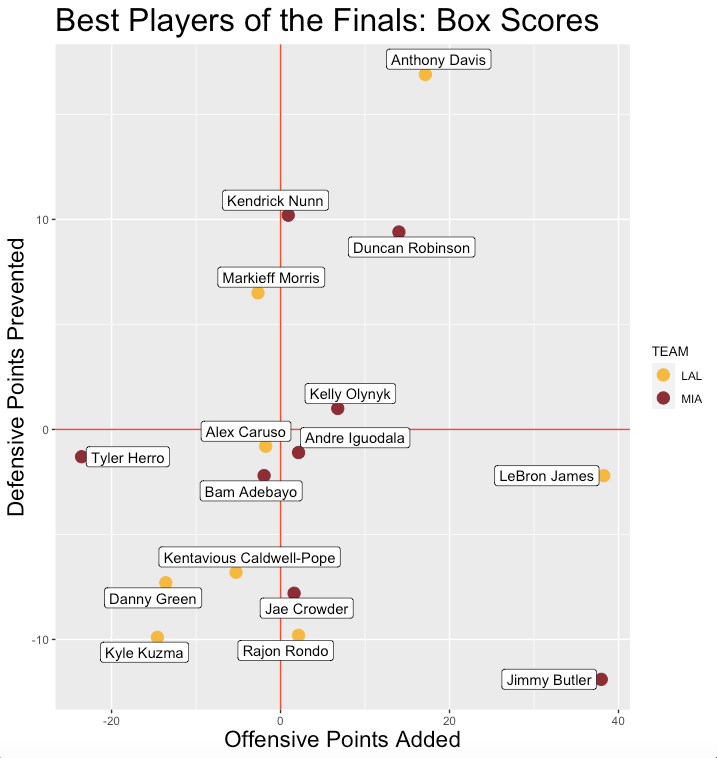
The first and most straightforward way of evaluating players is based off their box score stats. This is a great place to start since they give relatively detailed summaries of players’ contributions to their team’s performance.
When seeing how well a player does, it is important to not only look at the statistical totals, but also the efficiency. Therefore, I will see how each player did compared to the regular season league average, since it is not useful to have a player that puts up large numbers on bad efficiency. My methodology consisted of two steps: offense and defense. For offense, I further subdivided into two sections, which were shotmaking and playmaking. To evaluate shot making, I used true shooting percentage, which is a variation of field goal percentage which accounts for the value of each shot and free throws as well. To evaluate playmaking, I used estimations for assist points created and potential assists, both of which are tracking stats.

The final measure that I used to quantify a player’s offensive achievements was called Offensive Points Added. It pretty much is what it sounds like, as it measures how many more points the player contributed over an average league player would have given the same opportunity. The way that I calculated each player’s Offensive Points Added was like this:
- First I found the shot efficiency, which is true shooting percentage in the fraction form [ PTS / (FGA + 0.44*FTA) ]
- Then, I found the play efficiency by taking the assist points created and dividing by the combined potential assists (PA) and turnovers [ APC / (PA + TOV) ]
- To combine these two efficiencies, I used a weighted average with the weights as the proportions of plays involved by shooting or playmaking. For example, if 60% of a player’s opportunity came from shot attempts [ FGA + 0.44*FTA ] and 40% from playmaking attempts [PA + TOV], then the weight for shot efficiency would be 0.6 while the weight for play efficiency would be 0.4
- To find the final Points Added, I took the total efficiency, subtracted 1.13 (NBA Regular Season league average total efficiency), then multiplied by the total opportunity [ FGA + 0.44*FTA + PA + TOV ]
- A positive value indicates that a player did better than league average while a negative value indicated that a player did worse than league average
I used a similar method for finding the Defensive Points Prevented. I gathered the matchup stats from NBA.com which showed the total amount of points, field goal attempts, turnovers, free throw attempts, etc that a player faced on the defensive side. The only differences for the defensive formula were that I only used points (not assist points created) to determine the total defense while I only used field goal attempts, free throw attempts, and turnovers to determine the total opportunity (excluding potential assists). I excluded assist measures since I believe that it is not fair to count them against a defensive player. The league average for defensive efficiency for the 2019-2020 NBA season was 0.985. The final calculations are shown below.
- Defensive Efficiency (D_EFF) = DPTS / (DFGA + 0.44*DFTA + DTOV)
- Defensive Points Prevented = (0.985 – D_EFF) * PLAYS, where PLAYS = DFGA + 0.44*DFTA + DTOV
As seen by the chart, the best players based on the box score consisted of Anthony Davis, Duncan Robinson, LeBron James, and Jimmy Butler, while the worst players were Kyle Kuzma and Danny Green (only players with at least 100 minutes were included).
Using On Off Stats
While box scores are very good tools for summarizing a player’s contribution, they do not totally show a player’s full impact. For example, while a player like Steph Curry, a threat to shoot from anywhere within half court, may have a bad shooting game, he still may positively impact his team by drawing extra coverage and creating space. While the box score would indicate that Curry did poorly, on off tracking stats would better show his actual impact. On Off stats use player tracking to find how the player’s team’s offense/defensive rating was while the player was on the court and while he was off the court, then finds the difference.
The formulas for Offensive Points Added and Defensive Points Prevented using on-off ratings are shown below, along with a short summary explaining the formula.
- Offensive Points Added = (ORTG/100) * poss, where ORTG = offensive on-off rating and poss = FGA + 0.44*FTA + PA + TOV
- ORTG was divided by 100 to convert from a per 100 possessions stat to a per possession stat. I multiplied by the opportunity (FGA + … + TOV) in order to keep the total involvement of the player constant
- Defensive Points Added = -1 * (DRTG/100) * poss, where DRTG = defensive on off rating and poss = DFGA + 0.44*DFTA + DTOV
- The division by 100 and multiplication by possessions were for the same reasons as before. The only difference is multiplying by -1 at the beginning, which I did since a negative defensive on-off rating actually indicates that the team did better offensively while the player was on the floor

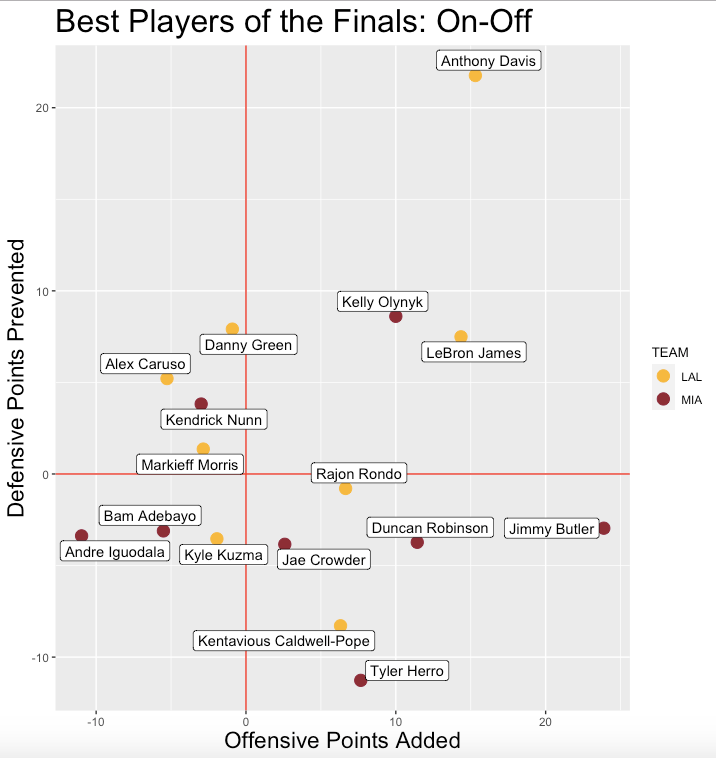
Using on-off stats, Anthony Davis was by far the best player, while LeBron James and Kelly Olynyk followed. The interesting cases to look at are those in which the on off scores and box scores differ significantly. One such case is Danny Green of the Lakers. While Danny Green shot poorly, the Lakers offense was actually much better with him, showing that his spacing positively affected the team. Meanwhile Jimmy Butler’s defense was likely not as bad as the advanced box score indicated, since the team was only slightly worse with him on the floor defensively. The last case is Tyler Herro, who shot at a low efficiency, but had a positive offensive impact nonetheless. The Heat shot better when Herro was on the court, so he must have been enough of a threat for the Lakers to put more focus defensively on him, opening up others for shot opportunities.
Combining Box Score and On Off Rating
The best way to fully evaluate players is to not use only box score stats or on off rating, but rather look at both together as a whole. While I could have given each player a single numerical rating using a weighted average of their box score rating and on off rating, I decided against it. This was because it is difficult to say exactly how they should be weighted. The importance of each really depends on your interpretation. If you think pure efficiency matters more, then box score stats would have a higher weight, but if you think that a player’s total impact matters most, then on-off rating would likely be weighted more favorably.
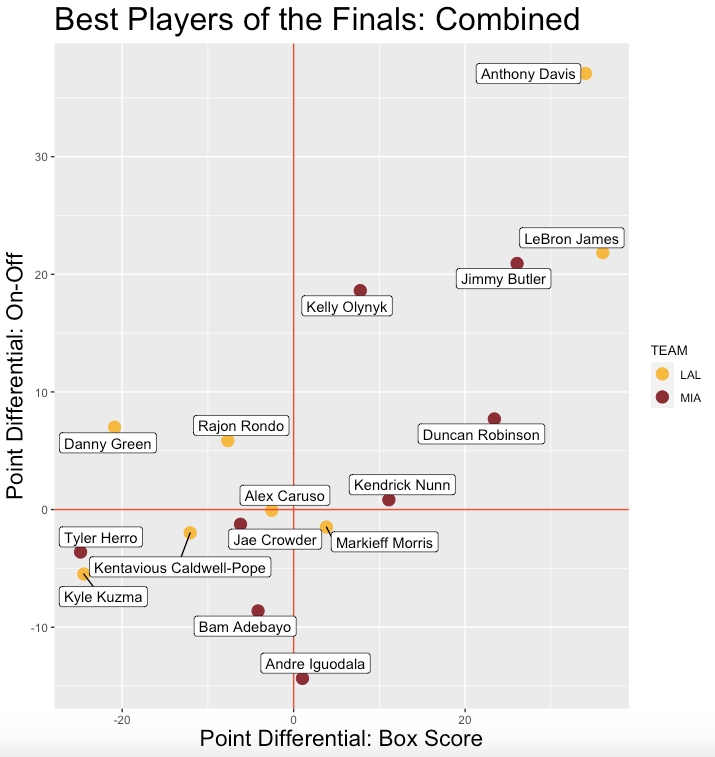
That said, I created a scatterplot showing that box score point differential on one axis and the on-off differential on the other. The point differential for each was found by simply adding the Offensive Points Added and Defensive Points Prevented. The players is the upper right quadrant of the plot were those that performed well in both methods. Therefore, Anthony Davis, LeBron James, Kelly Olynyk, Jimmy Butler, and Duncan Robinson were definitely helping their team. Meanwhile others such as Kuzma, Herro, and Adebayo were actually hindering their team, as a league average player likely would have performed better.
The only two players where the methods disagree somewhat significantly are Danny Green and Rajon Rondo. Green’s impact was discussed above, but Rondo also had a positive on off rating with a negative box score rating. The reason for this was his defense, as he recorded no forced turnovers and his opponents shot well against him. However, his teammates likely picked up his slack and he was not involved in too many defensive possessions, so it was not too big a deal.
So Who Should’ve Won Finals MVP?
Now, the final question to answer is who deserved the Finals MVP award. There are really only two contenders, being Anthony Davis and LeBron James. Again, your choice likely depends on your opinions. Anthony Davis was far superior defensively and had an impact that went beyond the box score, while LeBron James led the Lakers offensively at a superb efficiency and with high usage. It makes sense that LeBron James was chosen as the Finals MVP as he had more points, rebounds, assists, and a higher field goal percentage. However, taking a deeper look, Anthony Davis had a similar impact as he held his opponents to 40% shooting, forcing 15 turnovers in the process without fouling too often. While I personally would have chosen James as Finals MVP due to his offensive efficiency and high usage, Anthony Davis certainly had a very real case to make despite lower statistical totals.

This is very nice
LikeLike