
Quarterbacks are by far the most important position in the NFL. Having a great quarterback will lead to sustained success and a chance at a Super Bowl for any team lucky enough to attain one. However, there are not many stats that capture the full impact of a quarterback. Yet, only two stats are used often as catch all quarterback stats: Passer Rating and QB Rating. Therefore, I made an attempt to create my own quarterback stat: Quarterback Wins.
Note: All stats used from the 2020 Season only include the games played during weeks 1 to 6 (week 7 stats are not included)
QBW: The Formula
I created the formula for QBW (Quarterback Wins) by comparing a quarterback’s stats to their win percentage in games started. I wanted a stat that would correlate with winning, because ultimately that is the most important thing in football. Only box score stats were included as they are easier to gather and use than play by play stats. Therefore, I decided to regress several quarterback stats with win percentage using a logistic regression. This was done in order to keep the results within a range of values (0 to 100 once all calculations are completed).

The inputs that I used to create QBW were completion percentage (CmpP), touchdown Percentage (TDP), turnover percentage (TOP), yards per attempt (YA), sack percentage (SkP), and rush percentage (RushP). Each of these stats had a significant impact on predicting win percentage. Turnover percentage was the most significant, followed by rush percentage, sack percentage, and touchdown percentage. Using this, limiting turnovers is the most important thing for a quarterback, while the least important significant quarterback stat is completion percentage. Rate stats were better to use than totals or per game stats since they can be applied to any sample of pass attempts.
The formulas for each variable are shown below:
- CmpP = Cmp / Att,
- TDP = (PassTD + RushTD) / (Att + Rush)
- TOP = (Int + Fmb) / (Att + Rush + Sk)
- YA = Yds / Att,
- SkP = Sk / (Sk + Att)
- RushP = Rush / (Rush + Att)
The final regression output for the QBW calculation is shown below. Keep in mind that since it is a logistic regression, it only calculates the log odds, not the final rating.
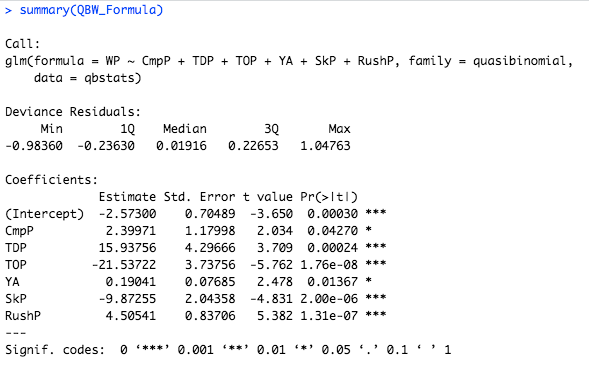
One stat which did not correlate in the way expected was rush yards per attempt. When inputted, its coefficient was negative, which goes against the logical thought that gaining more yards per rush leads to a better performance. It was also an insignificant variable so including it would not help the accuracy of the results any further. This likely was caused by the prevalence of QB kneels at the end of games. When a team is about to win, they often kneel in order to run the clock, which increases rush attempts but decreases rush yards per attempt, also explaining why rush percentage correlates so highly with win percentage.
In order to get the final QBW rating from the log odds, you have to do one more step, which is to exponentiate. The final formula for QBW is given below.
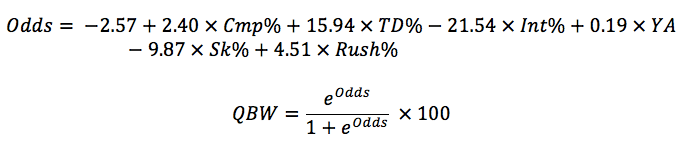
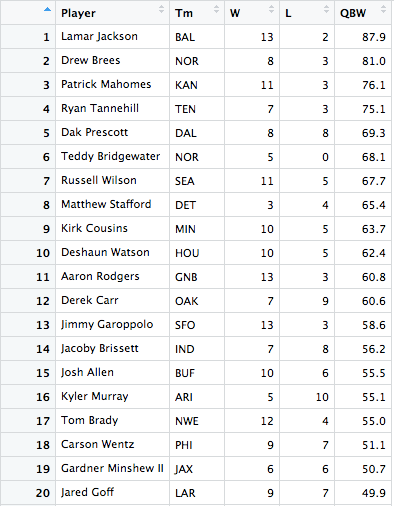
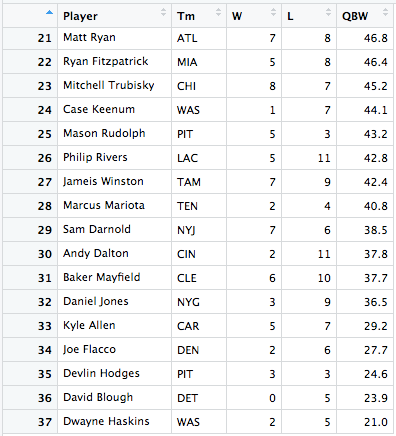
The QBW value can be interpreted as the expected number of wins an average team would have with that quarterback over 100 games. The average value is meant to be about 50, while the best quarterbacks have a QBW in the high 80s. For reference, the QBW of most of the 2019 NFL quarterbacks are given below.
Comparing QBW to Passer Rating and QB Rating
The two most commonly used quarterback catch all stats as passer rating and QB rating. Passer Rating uses a simple formula which is on scale from 0 to 158.3, while QB Rating uses play by play data and is on a scale from 0 to 100. By looking at the formulas and methods for finding each stat, I have found advantages and disadvantages of QBW compared to each.

Passer Rating
Advantages
QBW…
- Includes rushing stats instead of only passing stats
- Seems to better indicate the top players
- Correlates better with win percentage
- Is easier to Interpret
Disadvantages
QBW…
- Is found using a complicated formula
- Is less correlative year to year
- Probably over values rushing
QBR
Advantages
QBW…
- has a formula that is made public while the formula for QBR is not
- Correlates better with win percentage
Disadvantages
QBW…
- Over values rushing
- is unable to down weigh garbage time plays
- cannot take situation into account
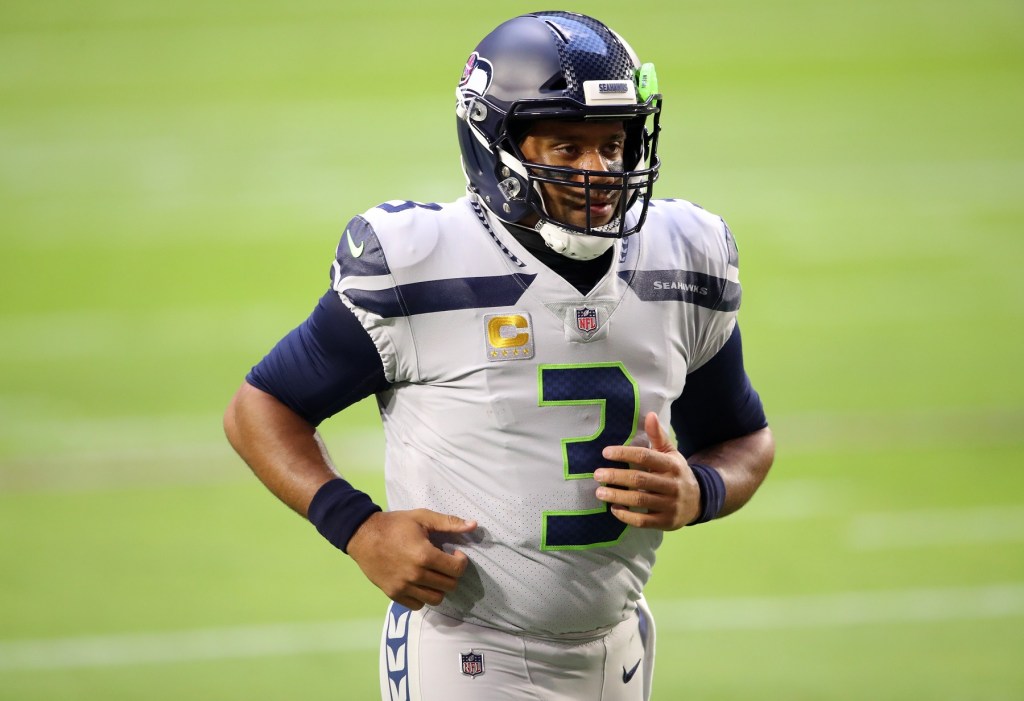
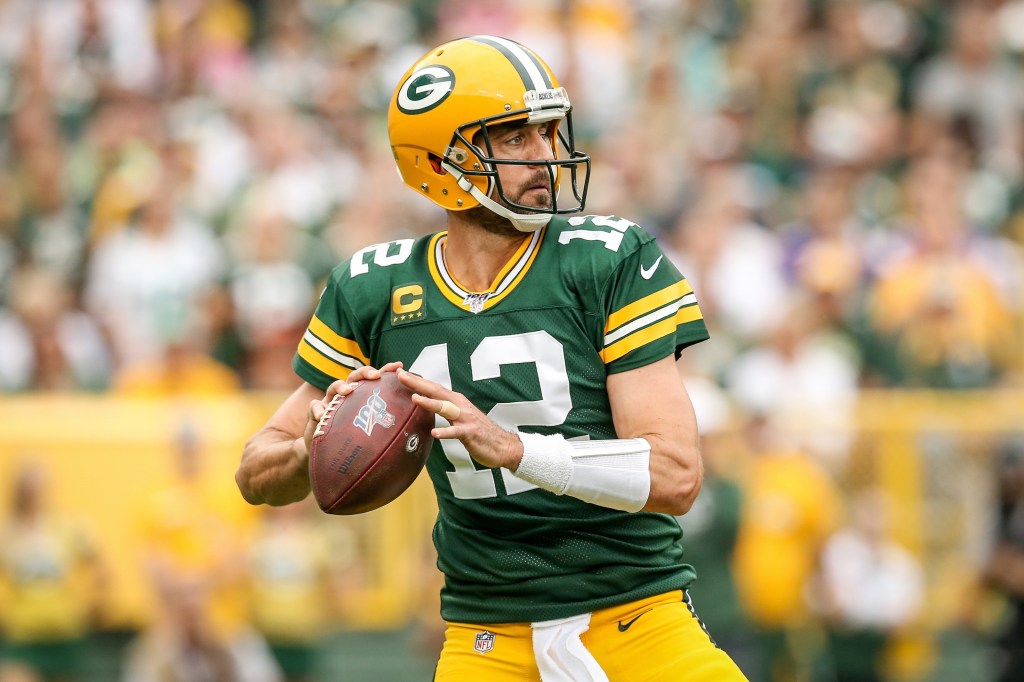
From this years’ stats for quarterbacks, QBW believes that the best quarterback so far has been Russell Wilson. All three stats agree on many of the top players, including Wilson, Patrick Mahomes, Josh Allen, Ryan Tannehill, Aaron Rodgers, and Derek Carr. However, some notable differences are Kyler Murray, Jared Goff, and Cam Newton. The reason that QBW has these players so much higher than the other two stats is that they are quarterbacks who like to run a lot, which boosts their rush percentage, the second most impactful variable in the QBW calculation. Passer rating does not take rushing stats into account, while QBR likely does not view them as important as QBW does.
MVP Rating
In order to put QBW to better use than just ranking quarterbacks, I created a stat that puts together a quarterback’s total team impact. Then, using that stat, which I call MVP Rating, I can predict who deserves the MVP that season.
The main component of the MVP Rating is a player’s QBW. Then, the total involvement of the player, the amount of wins the player has on his team, and games played are taken into account to find their MVP Rating.
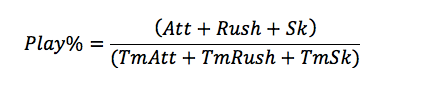
The MVP Rating is found by first calculating one other component: Play percentage. This is the proportion of the number of offensive plays that the player is involved with. The calculation for play percentage is below.
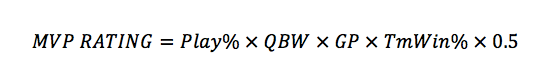
From that, the MVP Rating is found by multiplying the Play percentage by the QBW, games played, team percentage, and a constant of 0.5. By multiplying 0.5 with games played and team win percentage, we isolate the estimated number of wins contributed by the offense. Then, multiplying by play percentage further isolates the number of wins that a quarterback could have had anything to do with. Finally, multiplying by QBW (as a fraction) includes the quarterback’s total impact, therefore giving the MVP Rating.
The MVP Rating actually proves to be very good at choosing the quarterback that deserves to win MVP. It has predicted the MVP (if it was a quarterback) for every year since 2010, while QBW alone, passer rating, and QBR have not been able to do so. A table showing the MVP along with the player with the best measures in each stat is shown below.

- MVP Rating: 9/9
- QBW: 5/9
- Passer Rating: 3/9
- QBR: 6/9
The MVP Rating perfectly predicted the MVP in the nine years that a quarterback won MVP (Adrian Peterson, the runningback for the Vikings at the time, won the 2012 MVP). Out of the other stats, QBR did the best followed by QBW then Passer rating. Moreover, the MVP Ratings for this year so far have Russell Wilson as the MVP favorite (among quarterbacks), which lines up with the likely result of the MVP if it were awarded right now. Below are the initial MVP Ratings for 2020, where the games played for all quarterbacks is scaled to 16 (in order to account for bye weeks).
Note: Stats include games from weeks 1-6 of the 2020 NFL Season

Conclusion
I believe that QBW is a better stat than Passer Rating but maybe not as good as QBR. QBW is better than Passer Rating for several reasons. The first is in the formula. The formula for Passer Rating has four parts, with each using one of completion percentage, interception percentage, touchdown percentage, and yards per attempt. Then, they are combined to produce the final rating. While it is easy to calculate, it is too simple as it does not include anything about a quarterback’s ability to run. Moreover, the final value is not interpretable, while QBW can be interpreted as the average number of wins that an average team would have with the quarterback over 100 games.
However, QBW is probably not as strong as QBR. This is because QBR uses play by play data, while QBW uses only box score stats. Therefore, QBR is able to down weigh garbage time plays and take the situation into account, as 10 yards on 3rd and 20 are not as valuable as 5 yards on 3rd and 3. Additionally, QBR is able to separate the quarterback’s impact from the wide receivers as it can use stats like air yards and run after catch, while basic box scores do not capture those. However, one thing about QBW that is better than QBR is the difficulty in calculating it. The calculations for QBR are not released to the public but probably is very complicated, involving several steps. Meanwhile, while QBW is not easy to calculate, it is possible to find on a calculator or using a computer program.
I developed QBW as a way to better evaluate quarterbacks using only box score stats, which I believe I accomplished. It combines all the quarterback’s stats in a way that best predicts the winning percentage that an average team would have with the quarterback. By correlating with the only things that matters, wins, it truly finds a quarterback’s value. Moreover, the MVP Rating is able to consistently predict the NFL MVP, something that none of the other stats alone was able to do. QBW and MVP Rating are new ways of evaluating NFL quarterbacks.
A weekly updated ranking of 2020 QBW and MVP Ratings can be found under the created stats menu. It also shows the final 2019 QBW and MVP Rating of the top 20 quarterbacks last year.
