
Shot creating in the NBA is a skill that is crucial for success. The best teams are littered with shot creators, not only with their best players, but also in their other starters and some bench players. Having a plethora of shot creators allows an offense to be able to flow through many players, making it more fluid and unpredictable, and therefore harder to defend.
A shot creator in basketball can be defined as someone who can do what the name says: create shots. They can either create shots for themselves or their teammates, by penetrating the defense or by simply finding open players or by being able to create off the dribble. Often, the best players in the NBA are considered to be so good because they can create shots for themselves and their teammates. This is why everyone considers Russell Westbrook, an inefficient player (TS% = 0.537), as a better offensive player than Duncan Robinson, a very efficient player (TS% = 0.684). While Robinson is far more efficient, Westbrook is able to create his own shot or make a pass to an open player after driving. However, Robinson mostly only shoots three point shots that are not created by himself.
Methods
The goal of this study was to create a number that could summarize the shot creating skill of NBA players in a given season. I started by using two main stats: assists and unassisted field goals. Unassisted field goals are points that are produced by the player without help from his teammates, and assists represent the points created by finding open teammates. However, instead of just using assists, I used potential assists in order to capture the full potential contribution of a player to his team through his passing.
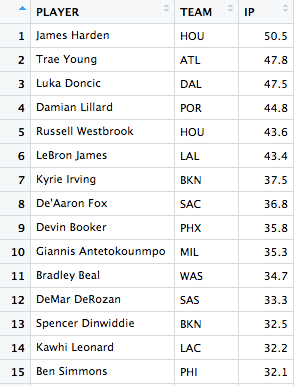
To start, I found the initiated points for each player. Initiated points are given to the players that create the shot, so it gives credit to the shooter if the shot is unassisted, but to the assister if the shot is assisted. To find the initiated points, I took the unassisted two point field goals times two, added them to the unassisted three point field goals times 3, then added the number of free throws (there was no stat showing how often free throws were assisted, so all of them went to the player who shot them for this exercise). Then, in order to capture the passing contribution, I took the potential assists and multiplied it by the average assisted field goal percentage (so players are not penalized for teammates not hitting shots) and then multiplied it by the average points per assist. The leaderboard for initiated points and initiated points per 36 minutes are shown below.

In order to find the score for shot creating, I wanted to include some method for estimating the efficiency of shot creating. Since data on unassisted and assisted field goal percentages were not available to me (only the percent of field goals assisted were available), I had to use the total field goal percentages as estimates (although unassisted field goal percentages are likely lower). To find the efficiency, I first calculated the total shot creating opportunity by adding the estimated unassisted field goal attempts, potential assists, and free throw possessions. After that, the efficiency could be calculated by taking the initiated points, then dividing by the opportunity and multiplying by 100.

The final shot creating score included two components: opportunity and efficiency. These were the two components since the best shot creators should be those who create many potential shots in their time on the floor and are also efficient while doing so. Therefore, I took the z-scores of the opportunity per 36 minutes and shot creating efficiency of players with at least 500 total minutes, then averaged them. The output is the shot creating rating. To find the shot creating score, I took the percentile of the players’ ratings, producing a value between 0 and 100, where 50 is an average shot creator.


Neither distribution for shot creating opportunity per 36 minutes or shot creating efficiency was Normal. For the opportunity, this was on purpose. While I could have used a transformation to create a distribution that was more symmetric, I decided to leave it as it was because I wanted to award the players that took many shot creating opportunities, as those players contribute far more often than the players that do not. Ideally, the efficiency distribution would have been Normal, but it is slightly left skewed. However, since it was close enough to symmetric, I left it as it was when averaging the z-scores.
The Best NBA Shot Creators

The next step of this project was to apply the results of the shot creating score to this past NBA season. Shown above is a table with the 20 best shot creators from the 2019-2020 NBA season. Most of the players on the list appear to make sense: Harden, Doncic, Lillard, and James are always at the top of peoples’ lists of best shot creators. However, there are a few surprises. They include TJ McConnell, Jordan McLaughlin, Jeff Teague, and DJ Augustin. McConnell is a surprise, but he should not be if you take a close look at his per 36 minutes stats. Because of his low utility by the Pacers, McConnell’s stats are not as gaudy as those above him, but he averages almost 10 assists per 36 minutes. In addition, less than a quarter of his two point field goals were assisted, showing he could create his own shot inside the arc. McLaughlin graded highly largely because of his high efficiency, which is likely to drop off, meaning his appearance could just be an aberration (since efficiency is less correlative than opportunity).
Teague is another underrated shot creator, as his minutes limit his stats. However, he also is assisted on just 16% of his 2 point shots (5th in NBA) and 46.5% of his 3 point shots (8th in NBA). While it may seem McConnell, Teague, and Augustin’s performances are outliers, their 2019 scores were also very high, meaning that they are underrated shot creators (2019 scores: McConnell – 77, Teague – 94, Augustin – 93). Even though players like TJ McConnell, Jeff Teague, and DJ Augustin are not popular names as good shot creators, they should be noticed more as their performances have been high for a couple of years.
The Worst NBA Shot Creators
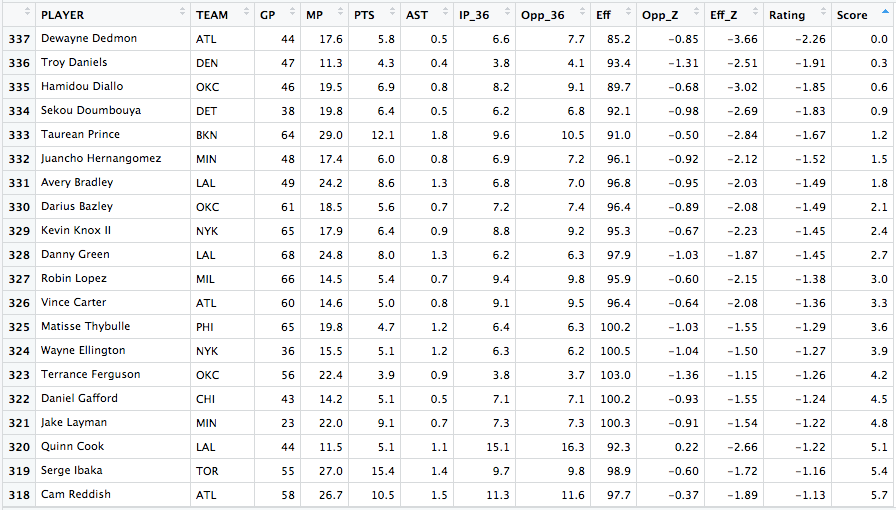
Many players in the NBA are unable to create their own shot and rely heavily on others to create for them. The players above both did not have many shot creating opportunities and were not efficient in their chances. This list contains several players that would be unable to lead their own team, which makes sense because none of them have had to or will have to. To make the results more exclusive, I filtered to show the worst shot creators among players with at least 20 points per game. The scatterplot below shows the relationship between points and shot creating score among the top players in the NBA, showing which players are worst suited to lead a team.
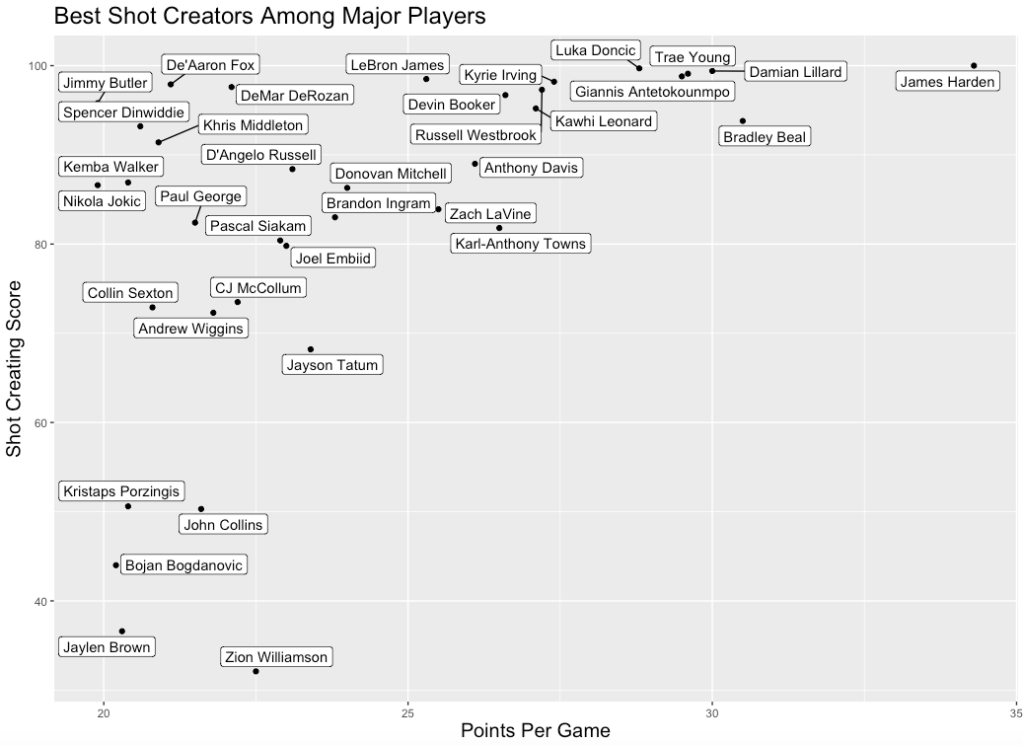
The players located lower on the scatterplot have a lower shot creating score, while those towards the left of the plot score fewer points per game. There are 6 players who scored above 20 points per game, but had a shot creating score less than 70 during the last NBA season. These players include Jayson Tatum, Kristaps Porzingis, John Collins, Bojan Bogdanovic, Jaylen Brown, and Zion Williamson. In order to see if any of these players were outliers, I looked at their 2019 shot creating score (if they played last year). In 2019, Jayson Tatum had a shot creating score of 47.5, John Collins had a 48.3, Bojan Bogdanovic had a 55.8, and Jaylen Brown had a 19.7. Since all of their scores were low last year as well, it is reasonable that these players are not capable of leading a team offensively. While this may not seem surprising for complementary players like John Collins, Bojan Bogdanovic, and Jaylen Brown, it is surprising for players that people think could lead their team one day, such as Jayson Tatum and Zion Williamson. This means that the Celtics and Pelicans will have to surround their superstars in order to maintain a proficient offense as just Jayson Tatum or Zion Williamson alone will struggle to create shots.
Year to Year Predictiveness
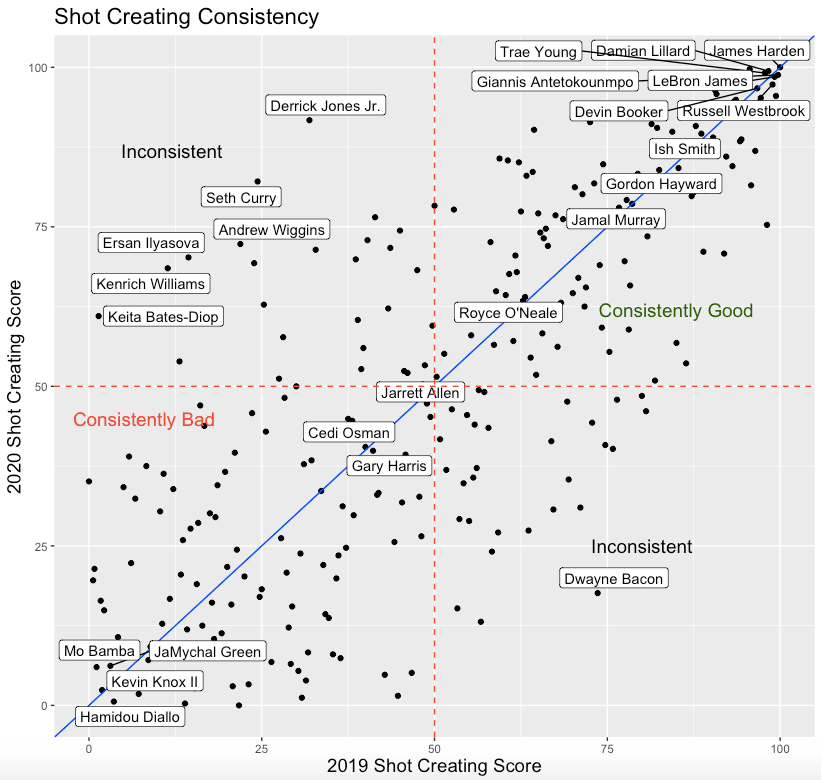
One trait of a good predictive stat is that it correlates well from year to year. This means that the values do not change greatly year after year and are relatively consistent. My shot creating score had a year to year correlation value of 0.762. In comparison, very consistent stats like points per game and assists per game had a year to year correlation somewhere between 0.85 and 0.87. This means that the shot creating score is pretty consistent for a non-counting stat.
From the graph above, you can see which players had consistent shot creating scores and which players had inconsistent ones. The players located closer to the line were more consistent, while those who were very far from the line were the most inconsistent. Consensus superstars like LeBron James, James Harden, Giannis Antetokounmpo, and Damian Lillard have been consistently great at shot creating. Of course, there were also consistently bad shot creators, like Kevin Knox and Hamidou Diallo. On the other hand, inconsistent players included Seth Curry, Andrew Wiggins, and Derrick Jones, all of whom had a high shot creating score in 2020 but a low score in 2019.
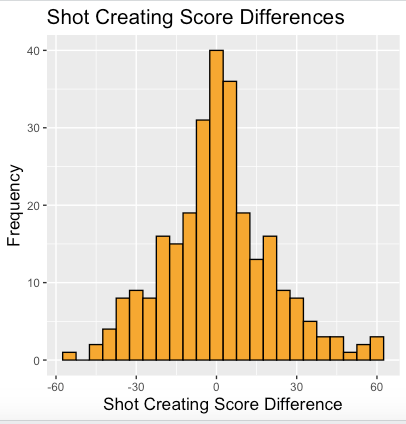
In order to get a sense of how much the shot creating scores differed from year to year, I took a closer look at the distribution of the shot creating score differences. As you can see, the distribution is centered around 0, which makes sense since the average shot creating score is 50 for all years. However, it is the spread that is interesting. The standard deviation of the shot creating score differences was about 20, meaning that the scores typically varied by about 20 points from the mean. Next, I examined whether the distribution was Normal or not in order to see if other assumptions could be made about the distribution.

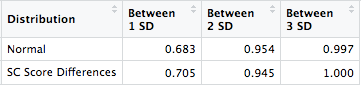
To assess the Normality of the distribution of shot creating score differences, I compared it to a Normal distribution. The distribution of the shot creating score differences was slightly narrower than that of a Normal distribution, but not clear whether or not it fits one. Therefore, I compared the amount of data located within one, two, and three standard deviations of the mean for both the shot creating score difference distribution and a Normal distribution (using the empirical rule). Most of the percentages lined up, as about 68-70% of the data lied between one standard deviation, about 95% of the data lied between two standard deviations, and almost 100% of the data lied between three standard deviations.
Since the distribution seems to be approximately Normal by using the empirical rule, other conclusions can be made about the year to year shot creating performances. Using the Normal cumulative density function, a player’s shot creating score will be within 13.5 points from the previous year’s score about 50% of the time. On the other hand, the score difference will be above an absolute value of 25 only about 20% of the time. Therefore, the reliability of these scores is high since they are not likely to change a great amount from year to year.
Conclusion
The shot creating ability can be summarized by analyzing the opportunity and efficiency of unassisted field goal attempts and potential assists. The best shot creators include stars like James Harden, Luka Doncic, and Damian Lillard, as well as uncommon players like TJ McConnell, Jeff Teague, and DJ Augustin. However, some superstars are not as well equipped to lead an offense, such as Jayson Tatum, Zion Williamson, and Kristaps Porzingis. Teams should make sure to surround these players with offensive playmakers whenever they become the leaders of their teams. Additionally, the year to year predictiveness of the shot creating score is high, as about 50% of the time the scores are within 13.5 points from year to year. Shot creating in the NBA is crucial to winning, and finding those players can boost a team to greater success.
