
In January 2012, when the Alabama Crimson Tide shut out their SEC rivals, the LSU Tigers, in the National Championship Game 21-0, the college football world looked towards forming a new system of determining a national champion. The Bowl Championship Series, abbreviated BCS, had been used for over a decade to put the two top teams into their own game to definitively decide the best team in the country. However, after controversies surrounding the inclusion of mid major teams and a championship game consisting of two teams from the same division in the conference (both Alabama and LSU played in the SEC West division), college football decided to use a committee and include four teams into a playoff.

However, 9 years after the infamous Alabama-LSU championship game, college football seems to be running into the same problems. In the CFP’s seven year history, no mid major team has ever cracked the top four, with the closest being UCF in 2018 and Cincinnati this season. Additionally, the committee seems to favor the same teams every year, with Alabama, Clemson, Ohio State, and Oklahoma acquiring 20 of the 28 total spots in CFP history. Now, those in college football have begun to lobby for an extended playoff, including 8 or 16 teams, so that all teams have a chance at winning.
Deciding whether the committee was correct or not is very subjective, since one’s opinions likely depend on what elements they feel are most important. Even though the committee’s decisions of this playoff may seem controversial, the most anyone can ask of them is to be consistent. Since the committee consists of people instead of a mathematical system, there is not always consistency in their choices. The CFP Committee should value all teams based on the same areas equally every year. The CFP website says that the selection committee ranks teams using “conference championships won, strength of schedule, head-to-head results, and comparison of results against common opponents to decide among teams that are comparable.” Using a regression model, we can see whether the committee has been consistent in their playoff choices this year and which teams they should have ranked higher or lower based on their past decisions.
The Model
Variable Choices
I chose the variables for the regression using what the CFP website says the selection committee uses to rank teams. First, I included win percentage as only teams with very good records have ever made the playoff. Then, the next variable incorporated was strength of schedule, gathered from college football reference. The strength of schedule on college football reference is calculated using margin of victory instead of win percentage, with the value indicating the points above or below average. Next, average margin of victory (MOV) was included in order to better represent the team’s actual skill (since an undefeated team with a large MOV is much better than an undefeated team with a lower MOV). The last two variables consisted of total games played and a dummy variable representing whether the team belonged to a power five conference. The total number of games played was included for two reasons: 1. to give a boost to teams that made their conference championship game, adding an extra game, and 2. to try to see how important Ohio State’s lack of games played this year should have affected them. Lastly, the power five dummy variable had a value of 1 if the team was in a power five conference or was Notre Dame (because while they are independent, the committee essentially treats them as a power five team) and a value of 0 if the team was an independent or part of a group of five conference. This variable helped to account for the committee’s tendency to favor power five teams greatly compared to group of five teams. Including a variable accounting for whether or not a team was a conference champion was not significant, meaning that the committee does not value it as strongly as they suggest.

The Application Method
In order to rank the top 25 teams, I had to first narrow the pack of 130 teams to a smaller sample. The goal was to use a linear regression to predict the CFP ranking of each top 25 team, but that would not work using all 130 teams since the 105 unranked teams would not have a value for the dependent variable (CFP ranking). Therefore, I used two regressions: the first was a logistic regression to predict whether or not a team should have been ranked and the second was a linear regression to predict what the team’s rank should have been. Both regression used all the same variables.
After I applied the first regression giving the probability of being ranked by the CFP committee, I took the top 35 teams and applied the linear regression to predict what their CFP rank would be. From that, I could take the top 25 teams and rank them in order to show how the committee should have ranked them based on their past rankings. The formulas for the two regressions are below.
Logistic Regression for probability of being ranked:

Linear regression for predicted CFP rank:
Analysis of Regression Output
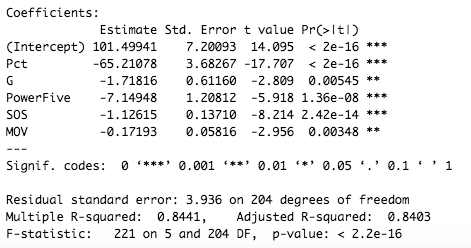
From the significance of the variables in the two regressions, we can see what the CFP committee really values the most. For considering which teams should be ranked, the order of significance was win percentage, then strength of schedule, then number of games, then whether the team was in the power five or not, and lastly margin of victory. For considering what rank each team in the top 25 should get, the most important variables were win percentage, then strength of schedule, then power five, then margin of victory, and lastly the number of games. The model was very good at predicting the rank of the CFP teams with a very high r-squared of 0.8441. From these variables, we can see that teams maximize their ranking by winning a lot, having a difficult schedule, and being in a power five conference.
Because strength of schedule is the second most significant variable in both regressions, we can conclude that the committee is true to their word in valuing strength of schedule greatly. However, it is also true that the committee has a large bias towards power five conference teams, even if they have comparable stats to non power five teams due to the significance of the power five dummy variable. The coefficient of -7.15 means that a group of five team would rank about 7.15 spots lower than a power five team on average given all the other stats are held constant.
Predictions for Past Playoffs
Based on the predictions from the linear regression model, we can see what the top 4 should have been for the CFP from 2014 to 2019. The predicted rank is given first, with the team’s actual CFP rank given in the parentheses.
- 2014: 1. Florida State (3) | 2. Alabama (1) | 3. Oregon (2) | 4. Ohio State (4)
- 2015: 1. Clemson (1) | 2. Alabama (2) | 3. Michigan State (3) | 4. Oklahoma (4)
- 2016: 1. Alabama (1) | 2. Clemson (2) | 3. Ohio State (3) | 4. Washington (4)
- 2017: 1. Georgia (3) | 2. Clemson (1) | 3. Wisconsin (6) | 4. Oklahoma (2)
- 2018: 1. Alabama (1) |2. Clemson (2) | 3. Notre Dame (3) | 4. Oklahoma (4)
- 2019: 1. Ohio State (2) | 2. LSU (1) | 3. Clemson (3) | 4. Oklahoma (4)
The results for the top 4 teams in the model were the same for 27 of the 28 total spots. The only time the committee was not consistent was when they put Alabama in the playoff in 2017 instead of Wisconsin, despite Wisconsin having a better win percentage, more games played, and a harder strength of schedule. The results for the committee and the model were the exact same in 3 years: 2015, 2016, and 2018. In 2014 and 2019 there were only slight differences, as the committee placing an undefeated Florida State team third in 2014 was uncommon (despite their abnormally low margin of victory) and Ohio State had a far superior margin of victory and strength of schedule than LSU in 2019.

Applying to 2020
The next step was to apply the model to the college football stats for 2020 in order to see if the committee was consistent in their choices. However, because of the lack of non conference college football games, the strength of schedule value was not comparable to past years. Since the strength of schedule is calculated by taking the average margin of victory of a team’s opponents, the averages across all the conferences were very close to zero as many did not have games against other conferences. Therefore, teams like Ball State, who played in the MAC, had a larger value for strength of schedule than teams like Alabama, which played an SEC schedule.
In order to fix this, I had to use the average conference strength of schedule from 2019 and incorporate it into the strength of schedule value for 2020. I was not really sure how to weigh the strength of schedules, so I estimated and chose 70% for the 2019 average conference strength of schedule and 30% for the 2020 actual strength of schedule.
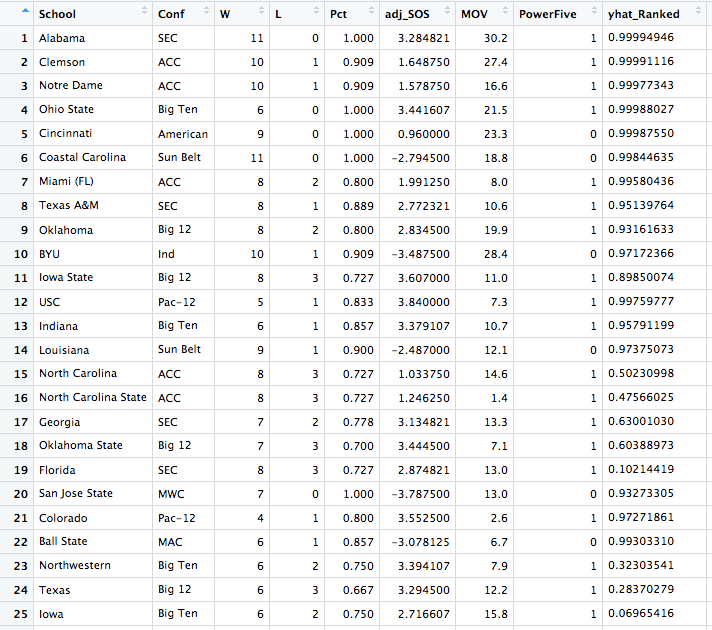
After applying the two regression, the final top 25 teams for the 2020 college football season were as follows.
The actual CFP rankings are shown below. Only the top 20 teams are displayed.
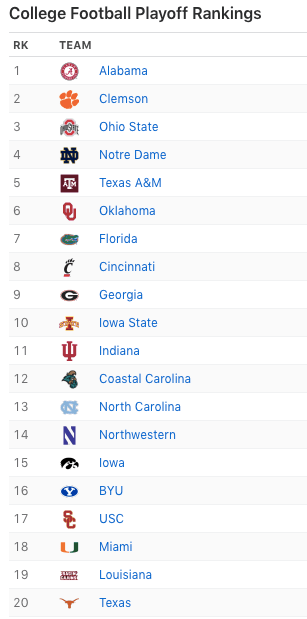
The first takeaway from the predicted CFP rankings should be that the top 4 teams (Alabama, Clemson, Ohio State, and Notre Dame) are the same, although the order differs slightly. Based on the committee’s past rankings, Notre Dame should have been seeded 3rd, ahead of Ohio State because they played 5 more games, even though they had a lower win percentage, margin of victory, and strength of schedule. However, it is understandable that the committee chose to rank Ohio State ahead of Notre Dame, since they did have a better margin of victory, strength of schedule, and win percentage. It also avoids a third matchup between Notre Dame and Clemson, who already played in the regular season and in the ACC Championship game.

After the top 4, the predicted results start to diverge from the actual results. Cincinnati should have been ranked 5th, followed by Coastal Carolina in 6th, because they were both undefeated and had a very high margin of victory. The undefeated record and higher margin of victory should have been enough to place them above Texas A&M, who did not win against their opponents by as much. Other non power 5 teams, like BYU and Louisiana, also were predicted to be ranked higher because of their win percentage and margin of victory. Louisiana even had a top 10 win, beating Iowa State in their first game of the season by 17 points. The committee’s choices of group of five teams was likely due to them valuing their strength of schedule based on past results, something that was difficult to account for this season without many non-conference games.
While most of the rankings of the power five teams were pretty accurate, there were some notable differences. Among them was the ranking of Northwestern. They only beat their opponents by about 8 points on average and only played 8 games, meaning that they did not deserve to rank as high as they did. For example, the two other power five teams that have had a win percentage between 70% and 80% and a margin of victory between 7.5 and 8.5 were LSU in 2017 and Utah in 2015, who ranked 17th and 22nd, respectively.

Lastly, the greatest disagreement between the model’s results and the actual CFP rankings was the placement of SEC teams. Both Florida and Georgia were predicted to be ranked relatively low, but they actually cracked the top 10 of the final CFP rankings. Florida had three losses and just a 73% win percentage, yet still finished 7th in the final rankings. They also only had one very impressive win, beating Georgia, while falling to the other top two SEC teams, Alabama and Texas A&M. Past power five teams with a similar number of losses, margin of victory, and strength of schedule ranked between 11th and 22nd. Georgia, meanwhile, also did not have a great win percentage or margin of victory. All of their stats were very slightly higher than Florida’s, meaning they also should have been in the 11 to 22 range. The committee obviously did not value win percentage as much as they have in previous years by putting Florida and Georgia over several teams with better win percentages.
Conclusion
The committee was consistent in choosing the top four teams for this season’s college football playoff. Alabama, Clemson, Ohio State, and Notre Dame were the four teams that most deserved to make the playoff based on the committee past rankings. However, the rankings outside the top four were not consistent with past seasons. Group of five teams such as Cincinnati and Coastal Carolina should have been ranked higher, but instead they were placed below multiple loss teams like Florida and Oklahoma. Some teams were ranked too high, such as Florida, Georgia, and Northwestern, because their rankings did not align with past power five teams with similar win percentages, margins of victory, and strengths of schedule. It seems that this year the committee did not value win percentage as highly as before, placing several teams with lower win percentages, like Iowa State and Florida, over teams with better win percentages, like Indiana and USC. Similarly, they valued the number of games played significantly more than they had any other year. The CFP committee did the best they could with limited games this season, but they chose the correct four teams for the playoff based on their past rankings.
