

Highly touted basketball recruits often have to make the choice of which college they will attend before they potentially enter the NBA Draft, decisions which have ramifications on their future careers. Making a smart college choice will allow recruits to improve their game and increase their draft stock, eventually resulting in being drafted at a higher pick than expected. Conversely, other prospects make the wrong college choice, usually resulting in a transfer after one year and a stark decrease in draft stock. This way, a recruit could be highly ranked in high school but go undrafted or very late in the NBA Draft. Additionally, players that make the wrong college choice and transfer have to wait longer to enter the draft and recover their fallen draft stock, sacrificing potential money that could have been made in the NBA if they made a better college choice, one which would have improved their college game. By analyzing the high school ranking and draft spot for basketball players in past years, we can find which colleges have historically helped their players increase their draft stock and helped their players’ future careers.
RSCI Rankings
The ranking system I used was the RSCI, or Recruiting Services Consensus Index. The RSCI is essentially a consensus ranking of high school basketball players, using inputs from several well-known high school basketball recruit rankings, including ESPN, Rivals, and 247 Sports. The websites that RSCI uses to form their consensus rankings change frequently, but the RSCI rankings are useful nonetheless as they show the overall opinion of the recruits in each high school class. The RSCI number 1 recruit for every high school class from 2006 to 2019 is shown below.
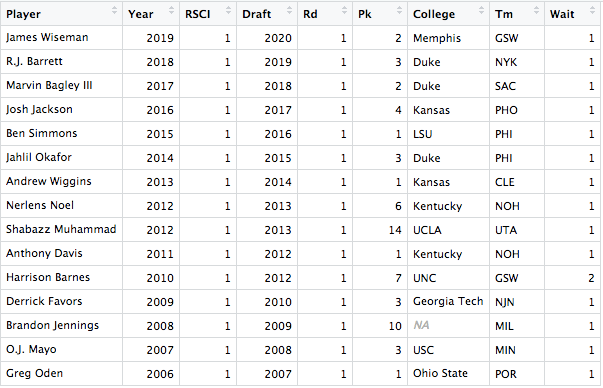
With the table above, you can already notice that there is a correlation between RSCI ranking and draft pick, which makes sense. The most highly ranked recruits are obviously going to get drafted higher, on average, than lower recruits. However, only the number 1 recruits are shown. There may be different trends as the high school ranking changes.
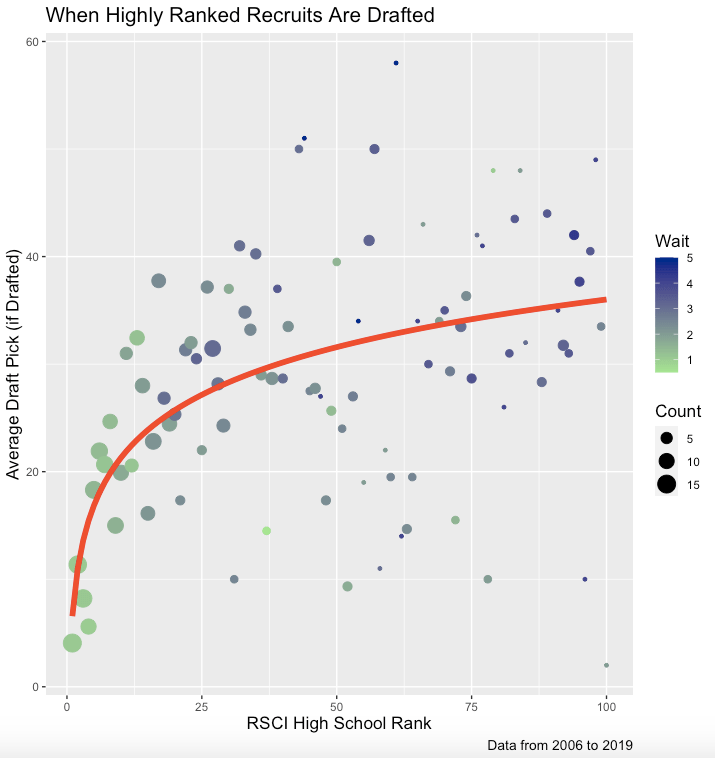
The table below shows the average draft pick, if a player was drafted, for each RSCI ranking from 1-100. The larger dots indicate more players drafted while the smaller ones indicate that fewer players were drafted. Additionally, the color indicates the average time between the players’ last season of high school and draft year. A greener shade represents that players waited for less time, like 1 or 2 years, and shades closer to dark blue represent players that had to wait longer, from 3 to 5 years. The most highly ranked recruits, namely those in the top 40 of the RSCI, have a relatively clear correlation between RSCI rank and average draft pick. However, lower ranked recruits, those ranked worse than 40th, show very little correlation, on average, between RSCI ranking and average draft pick. Additionally, players with RSCI rankings in the top 15 only have to wait 1 or 2 years, on average, until they get drafted. This means that top 15 recruits usually only have to wait until the end of the freshman or sophomore years until they get drafted, but others usually have to wait until the end of the junior or senior years, or even after a post-graduate year.
In addition to average draft position, the RSCI rankings give insight to the probability of being drafted or being drafted in the first round. The graph below shows how the probability changed depends on high school rank. For recruits within the top 10, the probability of being drafted is over 75%. The probability of being drafted decreases quickly, though, as a player’s high school rank goes down. For example, recruits that have a RSCI rank close to 20 are only about 50% likely to get drafted. Once a recruits rank gets closer to 50, the chance of being drafted falls to less than 25%. After that, the chance of being drafted flattens out, with only a small change as high school rank decreases. For example, recruits ranked close to 75 have about a 15% chance of being drafted, which is not a huge difference than those ranked around 50.
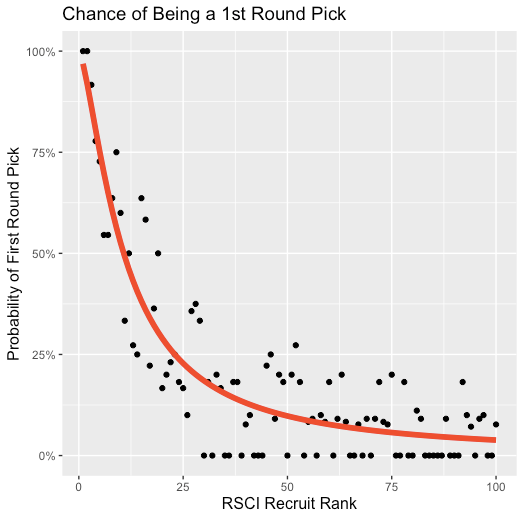
The chance of being drafted in the first round has the same overall trend as the chance of being drafted at all. For recruits tanked in the top 10, the chance of being a first round pick is over 60%. However, players ranked at 25 have only a 1 in 4 shot of being drafted in the first round and those ranked at 50 have about a 1 in 8 shot of being picked in the first round.
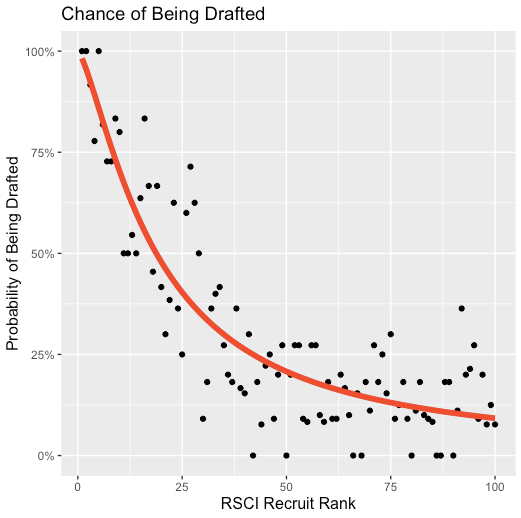
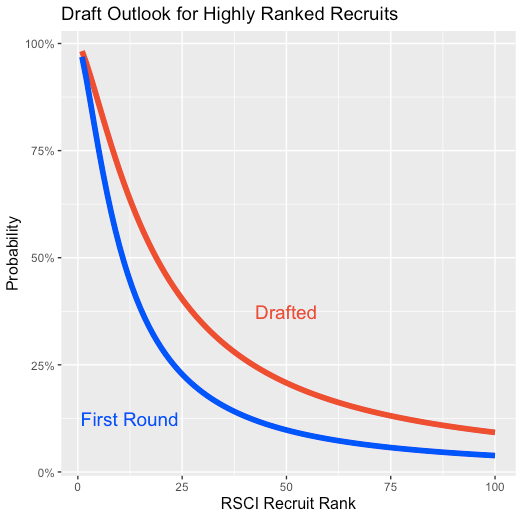
Using the previous two graphs, we can see the probability of being drafted and being drafted in the first round for all RSCI rankings from 1 to 100. Players ranked highly have a very high chance of being drafted and being drafted in the first round, but the gap between the probability of being drafted and being drafted in the first round increases significantly as the RSCI rank got worse.
Colleges
The most simple way to find which colleges are best for highly ranked high school recruits would be to use the average draft position of their top 100 recruits. Using this method for the 2006 to 2016 high school classes, we find that Washington usually produces the players that are drafted highest. Some top 100 recruits from Washington that were drafted highly in this period of time include Markelle Fultz, Marquese Chriss, Terrence Ross, and Spencer Hawes. All of those players went in the top 10 of their drafts. Duke is famous for being a great basketball school, so it is not surprising that they are second. The same goes for many of the other schools on the list, including Kentucky, Kansas, North Carolina, and Virginia. One notable surprising result is that No College ranks 9th in average draft pick. The No College category includes players that played overseas instead of in college, took a year off before the draft, or were old enough to enter the draft directly. Top 10 picks in this category include Enes Kanter, Emmanuel Mudiay, Thon Maker, and Brandon Jennings.

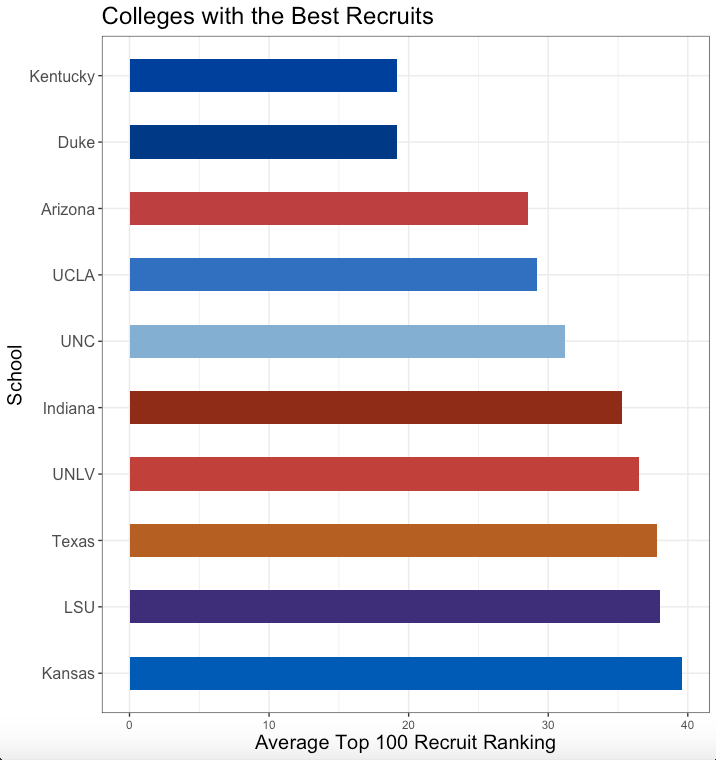
While the graph above seems to show the best schools for highly ranked recruits, it does not account for the fact that college basketball powerhouses like Duke and Kentucky consistently have some of the best recruiting classes. Since they have such good recruiting classes, pure talent could be a reason that so many of their players are being drafted. The graph below shows the schools that usually have the best recruiting classes. Kentucky and Duke have a significant advantage over the rest of the pack, with an average top 100 recruit ranking of less than 20. Other schools that recruit well include Arizona, UCLA, and UNC. The average draft pick for the schools represented in the graph below is so high partially because of the skill of their recruits.
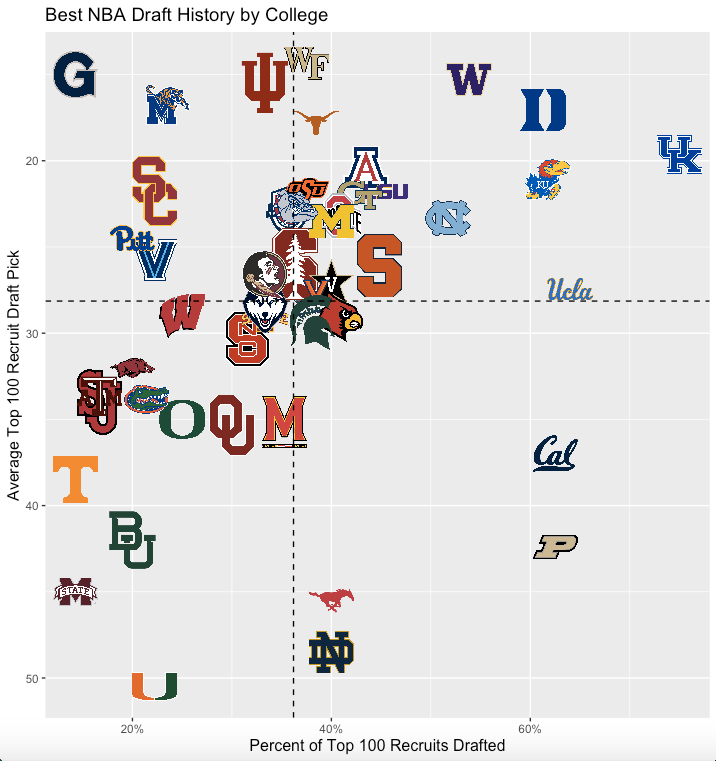
Another important part of college for high school basketball players is the opportunity for some lower ranked players to play well and have a chance of getting drafted. The graph below shows the colleges with the best and worse percentage of top 100 recruits drafted in addition to the average draft pick of their top 100 recruits. The schools located in the top right have both a high percentage of recruits that eventually get drafted and a good average draft pick if drafted. Conversely, the schools located in the bottom left corner have a low percentage of top 100 recruits drafted and a low average draft pick if drafted. The normal powerhouse schools, like Duke, Kentucky, Kansas, and North Carolina, appear in the top left as the best colleges for high school recruits. On the other hand, schools like Miami, Mississippi State, and Baylor seem to be worse for high school recruits as they do poorly in both categories. Once again, though, this version of the graph does not take into account the skill of the recruits when they arrive to the schools.
In order to adjust for the skill of the recruits already coming in for the percent of top 100 recruits drafted, we can find the expected percent of top 100 recruits drafted and compare it to the actual value. To get the expected percent, I found the sum of the probabilities of each player that attended each school, then divided by the total number of players. Then, to get the percent of top 100 recruits drafted over expected, that value was subtracted from the actual percentage of players that were drafted. The results are shown in the graph below.
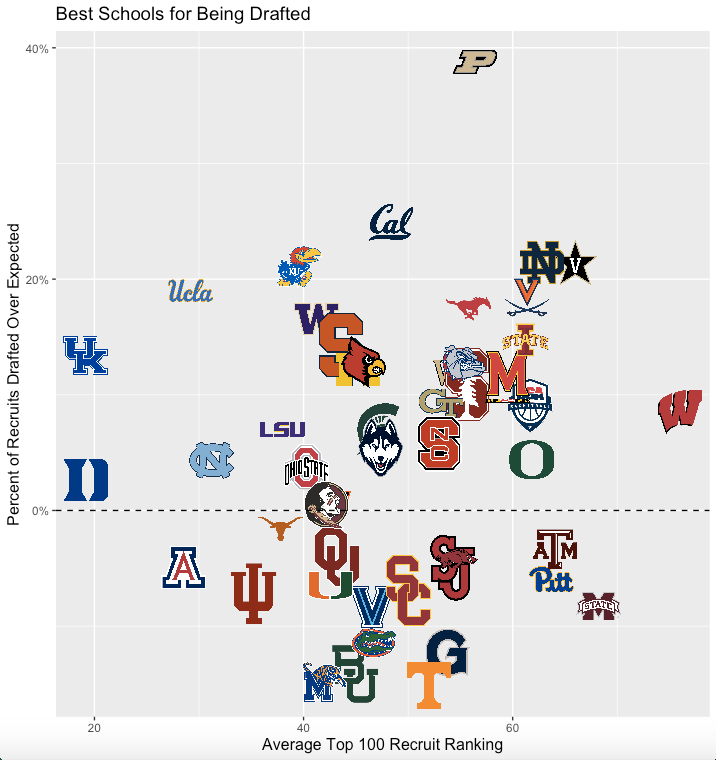
The schools that are located higher on the graph have had their recruits get drafted more often than expected, while those located lower on the graph have had their recruits get drafted less often than expected. The schools on the left side of the graph have better recruiting classes, on average, than the schools on the right side of the graph. Some of the best schools for getting drafted are Purdue, Kansas, Kentucky, UCLA, and Syracuse. Purdue does not usually bring in an impressive recruiting class, but it has given low ranked recruits a better chance to get drafted. Players that went to Purdue and were not expected to get drafted but did include AJ Hammons (13.1% to get drafted) and Robbie Hummel (16.7%). However, the results for Purdue may have been due to a small sample size of only 8 players. Kansas, on the other hand, performed well in this category with a far more sizable sample of 34 players. Kansas has helped several recruits ranked lower than 60 get drafted, including Marcus Morris, Markieff Morris, Devonte Graham, Tyshawn Taylor, Frank Mason, and Sviatoslav Mykhailiuk. The Morris brothers even got selected in the first round, while Graham and Mason both went on to become consensus first team All-Americans. Kentucky has helped low ranked recruits like Jamal Murray (14.0%) and Eric Bledsoe (20.0%) get drafted, UCLA has helped players like Aaron Holiday (17.0%) and Jordan Adams (17.3%) get drafted, and Syracuse has helped players like Tyler Lydon (13.7%) and Jerami Grant (37.6%) get drafted. Kansas, Kentucky, UCLA, and Syracuse should be colleges that low ranked high school recruits should try to attend as they have given their players a better chance to get drafted.
On other other hand, schools like Florida, UNLV (not pictured), and Georgetown should be avoided by high school prospects. These schools have consistently shown an inability to improve their recruits’ draft stocks. Only 21.4% of Florida’s 28 recruits have gotten drafted compared to an expected rate of 32.9%, UNLV has had just 3 of their 14 recruits drafted despite being able to recruit very good players, and Georgetown has had less than 15% of their recruits get drafted. These numbers do not only apply to low ranked prospects. High ranked recruits that have attended Florida, including Kasey Hill (67.5%) and Chris Walker (79.4%), did not get drafted despite top 11 rankings, and UNLV has not been able to have a recruit ranked lower than 10 get drafted. Florida, UNLV, and Georgetown are schools that high school prospects with draft aspirations should avoid.
Just like with the percent of top 100 recruits drafted, we can look at which schools had their recruits drafted higher, on average, than expected if they were drafted.
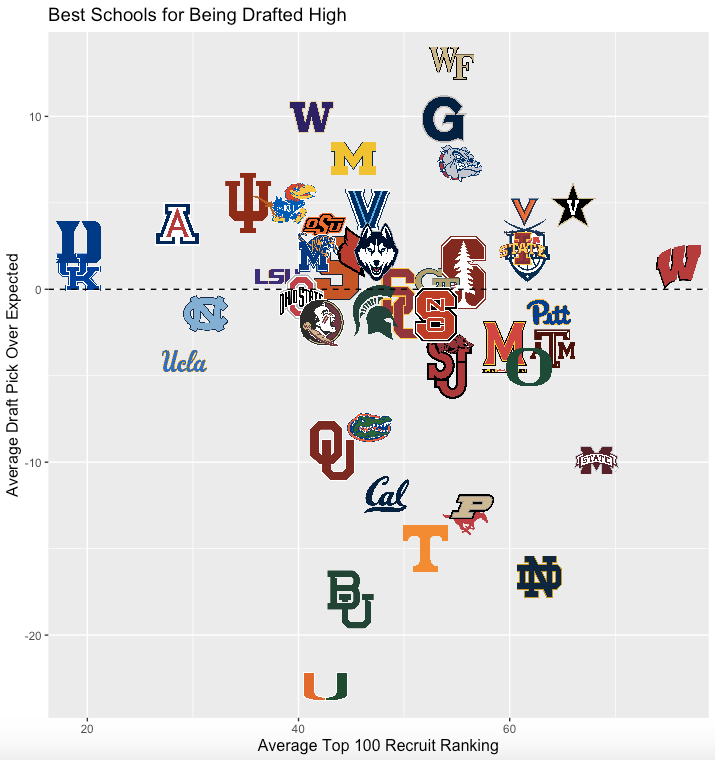
Among the colleges with at least 4 players drafted in the sample, Washington, Michigan, Gonzaga, and Kansas have been the best at getting their recruits drafted higher than expected by their high school ranks. Washington guard Markelle Fultz was picked first overall despite being projected to get picked around 17th based on his RSCI ranking. Additionally, they helped Marquese Chriss (expected pick of 31.8) get drafted 8th overall in 2016 and Terrence Ross (expected: 28.9) get drafted 8th overall in 2012. Michigan’s successes were with Nik Stauskas (expected: 34.4) getting drafted 8th and Moe Wagner (expected: 35.8) getting drafted 25th, while Gonzaga helped Domantas Sabonis (expected: 35.4) get drafted 11th and Zach Collins (expected: 27.9) get drafted 10th. Kansas was the only college to perform exceptionally on a large sample size, having players like Joel Embiid (expected: 24.3), Thomas Robinson (expected: 27.9), and Ben McLemore (expected: 30.3) get drafted in the top 10 despite low expected pick values.
The worst colleges in this category with at least 4 players drafted in the sample include Purdue, California, and Florida. Purdue’s main failure was with E’Twaun Moore, who was drafted as the 55th pick in the 2007 draft with an expected pick of 26.6. While California had one of its most notable recruits, Jaylen Brown, succeed and get drafted 3rd overall in 2016, their other most notable recruit, Ivan Rabb, was drafted 35th overall despite being ranked 5th in his class and having an expected pick of 16.9. Another one of its higher ranked recruits, Jabari Bird was also selected very late in the draft (56th overall) despite an impressive ranking in high school (20th). Lastly, Florida was not good at producing players that got drafted better than expected before college. Two of their best recruits, Vernon Macklin and Nick Calathes, were drafted in the late second round even though being ranked 16th and 11th in their respective high school classes.
By combining the previous two graphs, we can see which colleges have been the best in improving their recruits’ draft stocks by both boosting the rate at which they got drafted and raising their draft position.
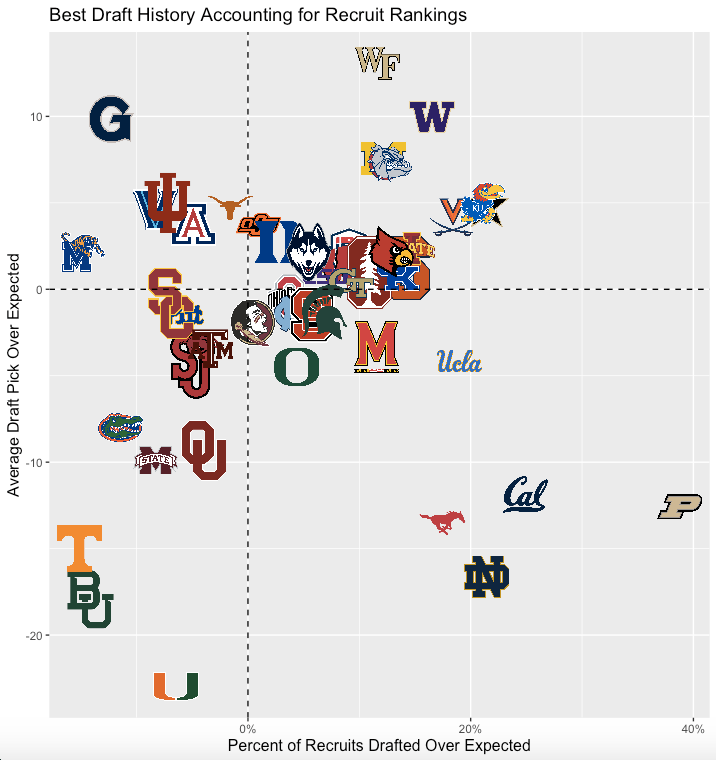
The schools located in the top right of the graph performed well in both categories. High school players would have a better chance of accomplishing their dream of making it to the NBA if they attend these schools, including Washington, Kansas, Michigan, and Gonzaga. Contrastingly, the schools located in the bottom left corner have the opposite effect. Schools like Florida, Miami, Baylor, and Tennessee have been unable to boost the draft stock of their recruits. The schools located in the bottom right and top left corners are more difficult to evaluate. Those in the bottom right have shown to increase the likelihood of their recruits getting drafted, but decrease their expected draft position. Schools from this section, like Purdue and California, are probably better options for lower ranked recruits as it would improve their chance of being drafted, which is already low. Those in the top left region of the graph have shown to decrease the likelihood of their recruits getting drafted, but increase their expected draft position. Schools from this section include Georgetown and Memphis, and they should be attended by higher ranked recruits willing to take a risk as it is possible they are drafted much higher than expected or don’t get drafted at all.
It is also important to address the shortcomings of this study. For the sample, I only used the recruiting classes from 2006 to 2016. This means that the more recent results were left out. I had to exclude the classes from 2017 to 2019 because all of their recruits have not completed their college careers, as some of the players from the 2017 class are still completing their senior year. Additionally, the samples of the number of recruits and number of players drafted from each school are very small, as the largest sample was Kentucky with only 40 players (Most ranged from 10-20 players, though). Lastly, my methods do not take into account the fact that schools may not be the only reason that a certain player was drafted higher or lower than expected. Other factors like play style, personal issues, and coaching changes certainly affect an prospect’s draft stock or performance in college. Nonetheless, the best colleges for top 100 high school recruits are likely Washington, Kansas, Michigan, and Gonzaga as they improve the probability of their recruits getting drafted and their expected draft position.
