

Player defense has been one of the hardest elements to quantify in basketball since the rise of analytics. The box score stats for player defense are limited to steals, blocks, and defensive rebounds, with no context for the number of shots defended and how many turnovers a player actually forced. However, recent tracking statistics have made it easier to see which players are really making an impact on the defensive end through contesting shots, forcing turnovers, and grabbing difficult defensive rebounds. Using stats from NBA.com, I created a new metric to quantify a player’s defense: Tracking Defensive Plus Minus. Unlike common defensive metrics such as individual defensive rating or DBPM, Tracking Defensive Plus Minus (TDPM) uses data on shots where each player was the closest defender, deflections, and contested defensive rebounds to create a catch-all defensive impact stat.
Shot Contesting
The three primary elements of TDPM, as explained above, are shot contesting, forcing turnovers, and defensive rebounding. The most important by a significant amount is shot contesting. The best defensive players anchor their teams by defending a lot of their opponents’ shots and keeping their opponents below the expected field goal percentage. Therefore, used a combination of two other stats to quantify a player’s shot contesting ability: Defensive Field Goal Percentage Over Expected (DFGPOE) and Defensive Field Goal Attempt Rate (DFGA Rate).
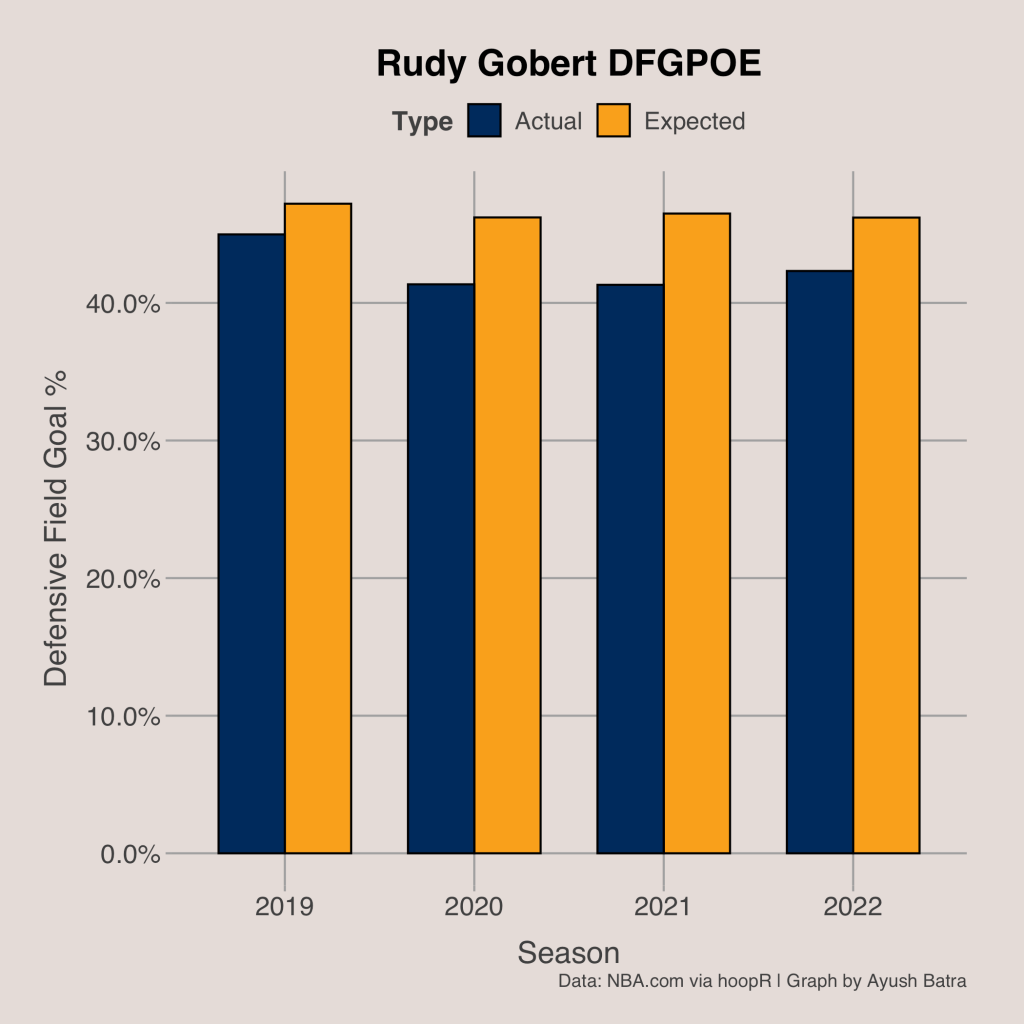
The NBA’s website for shots defended divides defensive field goal attempts into three categories: 6 feet or fewer from the rim, 10 feet or more from the rim, and 15 feet or more from the rim. I chose to only use the categories for 6 feet or fewer from the rim, which I categorized as shots at the rim defended, and 15 feet or more from the rim, which I labeled as perimeter shots defended. The area between these two sections (6 feet from rim to 15 feet from rim) includes the mid-range shots defended. To create the expected defensive field goal percentage, I multiplied the average FG% from each section by the frequency of shots defended in each section. For example, Rudy Gobert defended 36.2% of his shots at the rim, 24.1% from mid-range, and 39.7% at the perimeter. The average FG% at the rim this season is 60.0%, the average mid-range FG% is 41.4%, and the average perimeter FG% is 36.7%. Therefore, Gobert’s expected defensive field goal percentage is 0.362 × 0.600 + 0.241 × 0.414 + 0.397 × 0.367 = 46.2%. His actual defensive field goal percentage was 42.3%, so his DFGPOE is 42.3% – 46.2% = -3.9%. For DFGPOE, a negative value is better as it indicates that a player is allowing fewer field goals than expected. If players like Rudy Gobert have a consistent negative DFGPOE, they are making a significant positive impact on their team’s defense.
Defensive Field Goal Attempt Rate, the second component of a player’s shot contesting impact, is the percent of player defensive possessions that the player was the closest defender to a shot. A high DFGA Rate indicates that a player contests a lot of shots and is very involved in his team’s defense.

As seen by the graph above, the players with a high DFGA Rate (including Jakob Poeltl, Nikola Jokic, and Gobert) are the closest defender to a shot on about 30% of their defensive possessions. However, other defenders like Evan Mobley and Jarrett Allen still allow far fewer field goals than expected despite defending a lower percentage of shots.
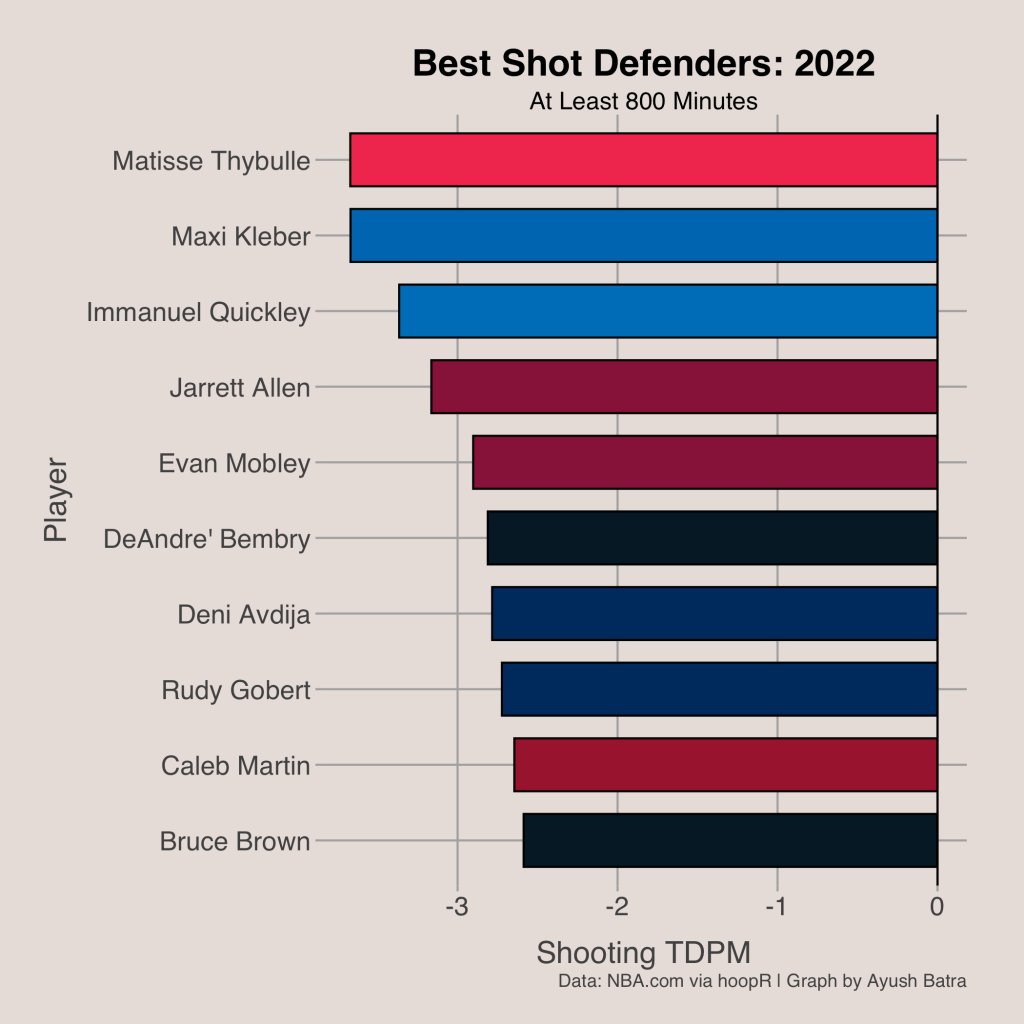
The ultimate goal is to find out how much each player’s shot defense changes their team’s points allowed per 100 possessions. In order to do this, we can multiply the DFGPOE by the DFGA Rate, then multiply by 100 to obtain the number of field goals allowed over expected over 100 possessions. Then, to convert to points, we have to multiply by a number between 2 and 3. This depends on the frequency of 3-point shots each player defended. All 3-point shots fall into the category of perimeter shots, so I estimated the average points per field goal allowed as 2 + 0.5 × Perimeter Frequency. This estimates that 50% of perimeter shots are 3-point attempts. Finally, I calculated the Shot component of TDPM as 100 × DFGPOE × DFGA Rate × (2 + 0.5 × Perimeter Frequency). The leaders Shooting TDPM this season are shown below.
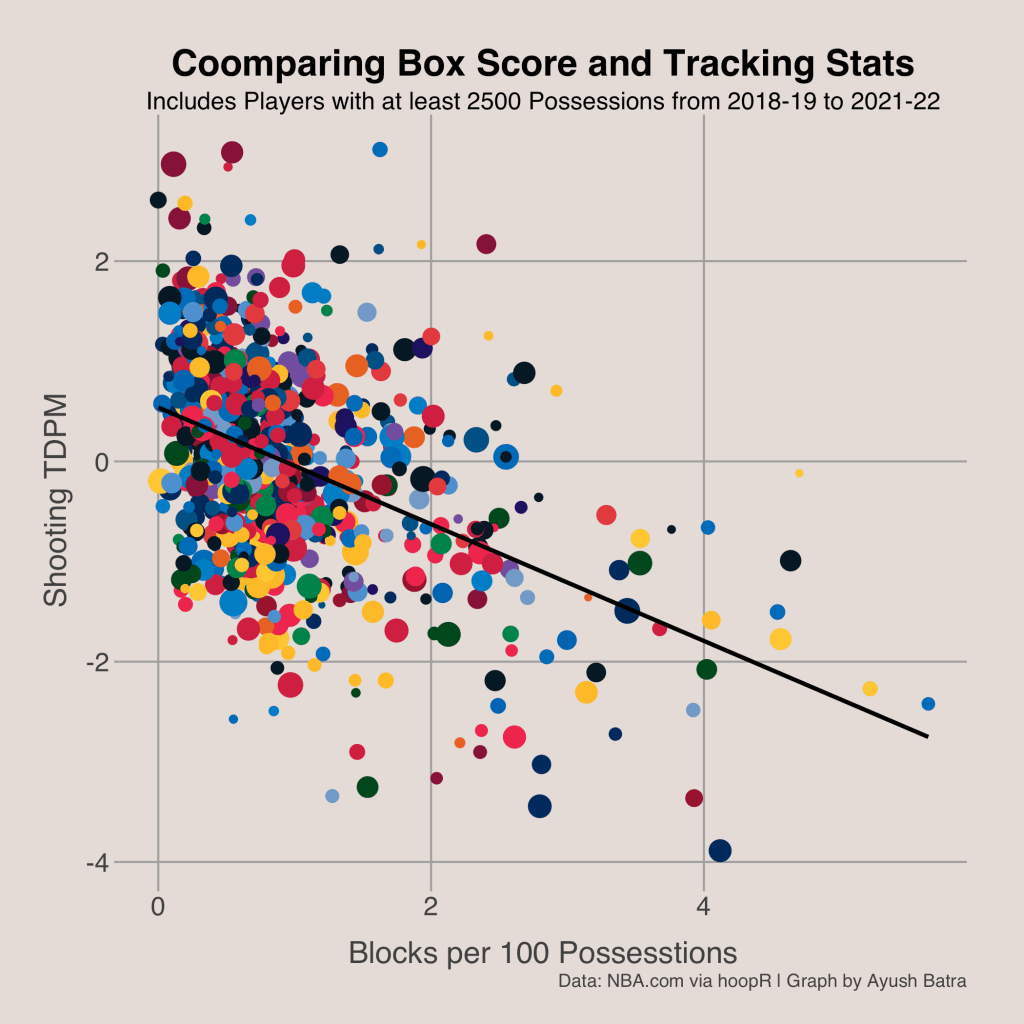
When comparing the Shooting TDPM to blocks per 100 possessions, we can see that blocks do not accurately capture a player’s shot contesting ability, making it difficult to determine good defenders using box score statistics alone. For example, in 2020 both Giannis Antetokounmpo and Kyle Anderson had less than 2 blocks per 100 possessions, but they had a Shooting TDPM in the 99th percentile.
Lastly, it is important to note that while player defensive field goal percentage is an important stat, it is also a very noisy one. It is best to use these tracking defensive stats in large sample since opponent shooting is still a very random event. For example, of the top 10 non-rookie shot defenders this season, only 4 (Thybulle, Allen, Gobert, and Jaren Jackson Jr.) were in the 80th percentile or better last season. Furthermore, the defensive field goal percentages for shots at the rim are far more consistent than those for shots on the perimeter, so the Shooting TDPM will be more consistent and accurate for rim protectors (like Allen, Gobert, and Jackson Jr) as opposed to perimeter defenders.
Forcing Turnovers
The second most important element of defense behind shot defense is forcing turnovers. This skill is pretty accurately estimated by steals. After all, a steal is the cause of almost 55% of turnovers. The other 45% are unforced turnovers.
However, a more telling stat of how many turnovers a player has the potential to force is deflections. As opposed to steals, which are only logged if the defense obtains possession, a deflection captures every time that a defender knocks a ball away (as long as it isn’t on a shot attempt). After a defender deflects the ball, a loose ball results. Loose balls in basketball are similar to fumbles in football, in that recovery rates fluctuate. Furthermore, deflecting the ball no doubt causes the opponent to have a lower offensive efficiency as they have to reset their offense with less time on the shot clock. For these reasons, deflections are the best measure for a defender’s ability to force turnovers.

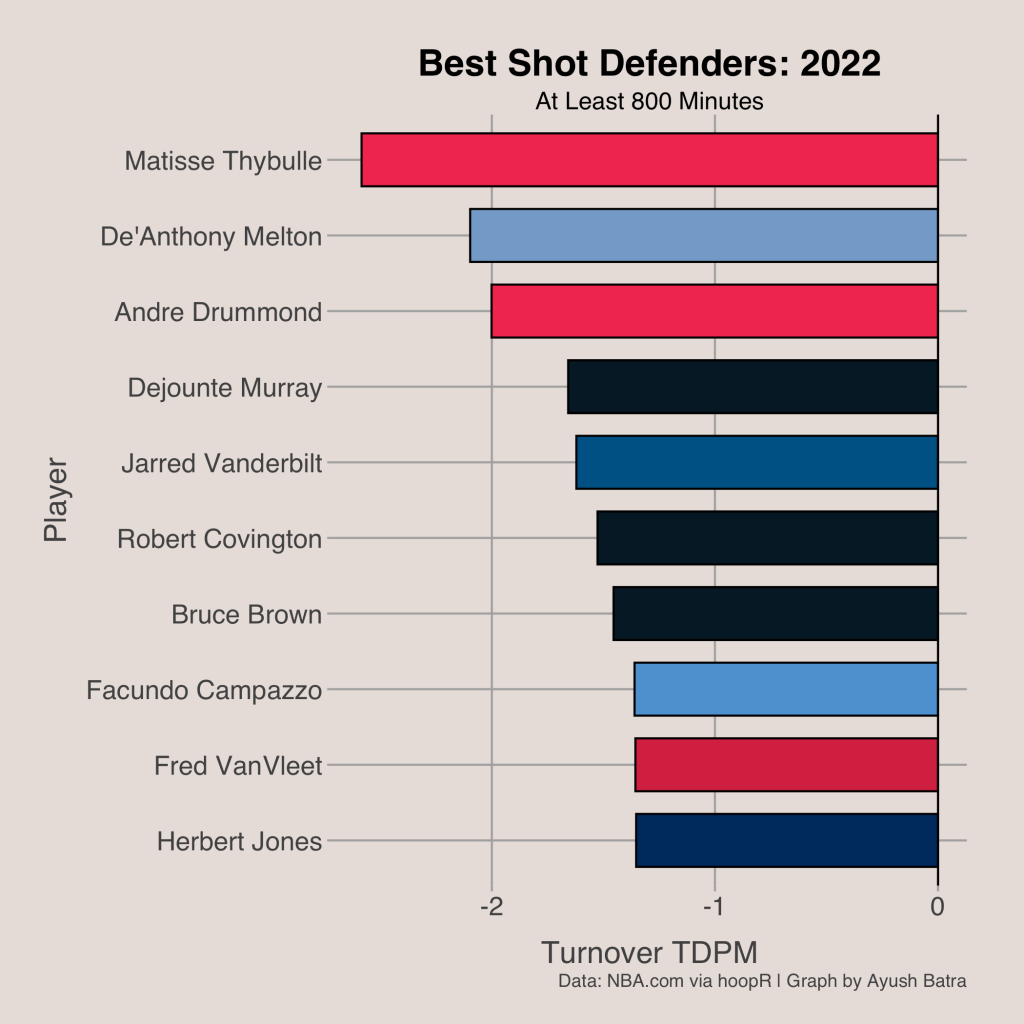
Using deflections and steals per 100 possessions, I created the turnover component of Tracking Defensive Plus Minus (Turnover TDPM). The formula for Turnover TDPM is as follows:
Turnover TDPM = -1 × League Average Pts/Poss × ( League Average Recovery Rate × Deflections/100 – League Average Player Steals/100 ).
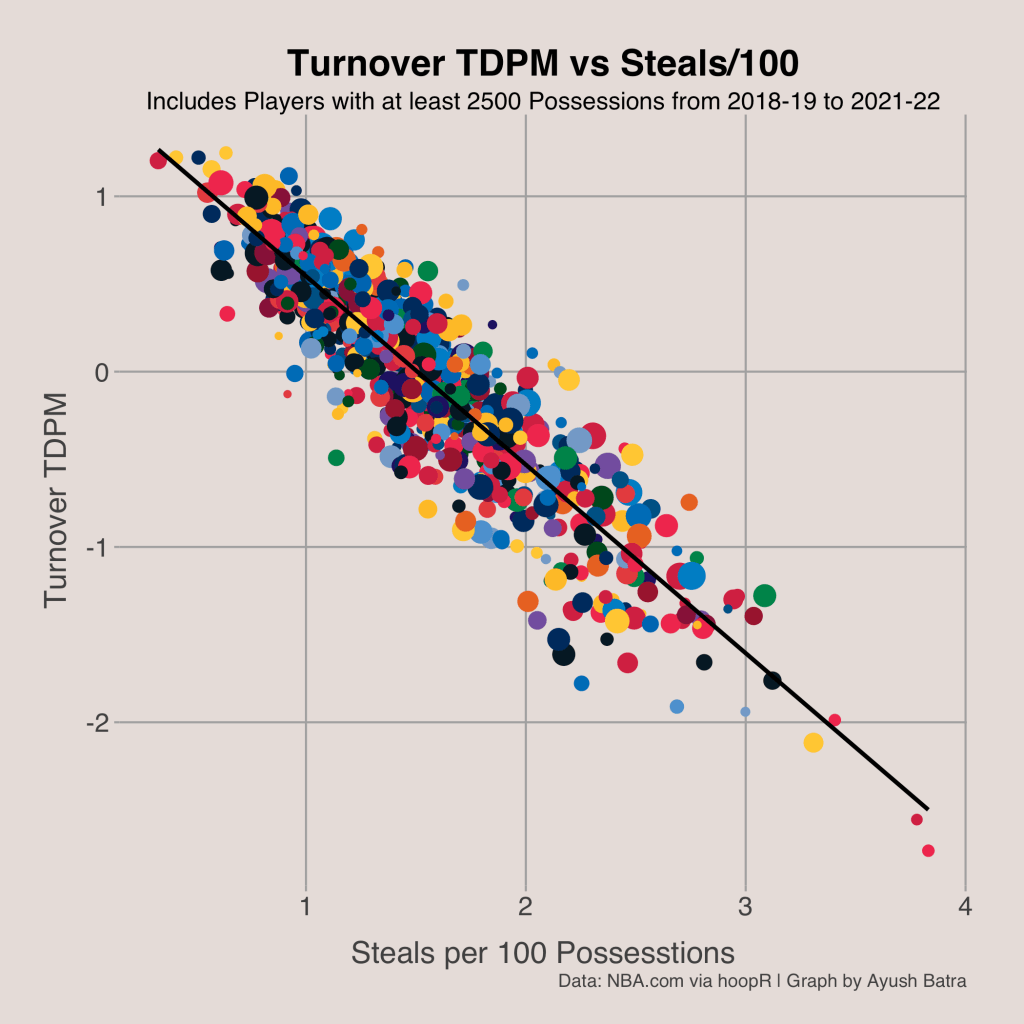
Basically, what this formula is doing is finding how many points a player prevents per 100 possessions thorough their deflections. To get the number of expected steals without the randomness of recovering the ball, I multiplied the league average recovery rate of deflections (54%) by the player’s deflections/100. Then, I subtracted the league average steals/100 for a player (about 1.5) to get the number of steals over the average player. After obtaining this number, I multiplied by the negative of the league average points per possession (about 1.10) to estimate the number of points saved through steals (since when a steal occurs, the offense’s pts/poss is 0). Again, a more negative value implies that a player is better at forcing turnovers, which is consistent with the format of Shooting TDPM. Ultimately, the Turnover TDPM is a linear function of deflections per 100 possessions, where the slope depends on the league average points per possession and recovery rate. The players with the best Turnover TDPM’s are shown below. Additionally, steals per 100 possessions serves as a very good estimator for Turnover TDPM, which makes sense because Turnover TDPM is a linear function of Deflections per 100 possessions, which is heavily correlated with steals per 100 possessions. The only thing that causes the Turnover TDPM to not be a linear function of Steals/100 is the randomness of loose ball recovery rate.
Defensive Rebounding
Defensive rebounding is less important and easier than shot defense and forcing turnovers, but it is still important to prevent offenses from obtaining extra chances to score. The problem with defensive rebounding is that the majority of defensive rebounds are very easy to grab and require almost no effort. There are many, many instances of defensive rebounds where the ball simply happens to come to the rebounder without any players going for the rebound with them. These types of uncontested defensive rebounds are not valuable, as any random person would do the same thing. The types of defensive rebounds that are valuable are the contested defensive rebounds, where a defender has to box out an opponent or jump first to beat out an opponent. Using tracking stats, we can reward players with a high number of contested defensive rebounds.
However, big men often grab almost all of the contested defensive rebounds. This is because they are taller than everyone else and they are often already close to the rim because they guard other big men who stay in the paint. To ensure that there is not too much of a skew towards big men in the defensive rebounding component (causing bad defenders who get a lot of rebounds to artificially seem like good defenders), I ran a regression to calculate the expected number of contested defensive rebounds per 100 possessions a player should grab given their Defensive Field Goal Attempt Rate and frequency of shots defended at the rim. These two variables were used because if a player is defending a lot of shots, he is often very close to the rim, which makes it easier to grab contested rebounds since the player is already in position and doesn’t have to move too far to get the rebound.
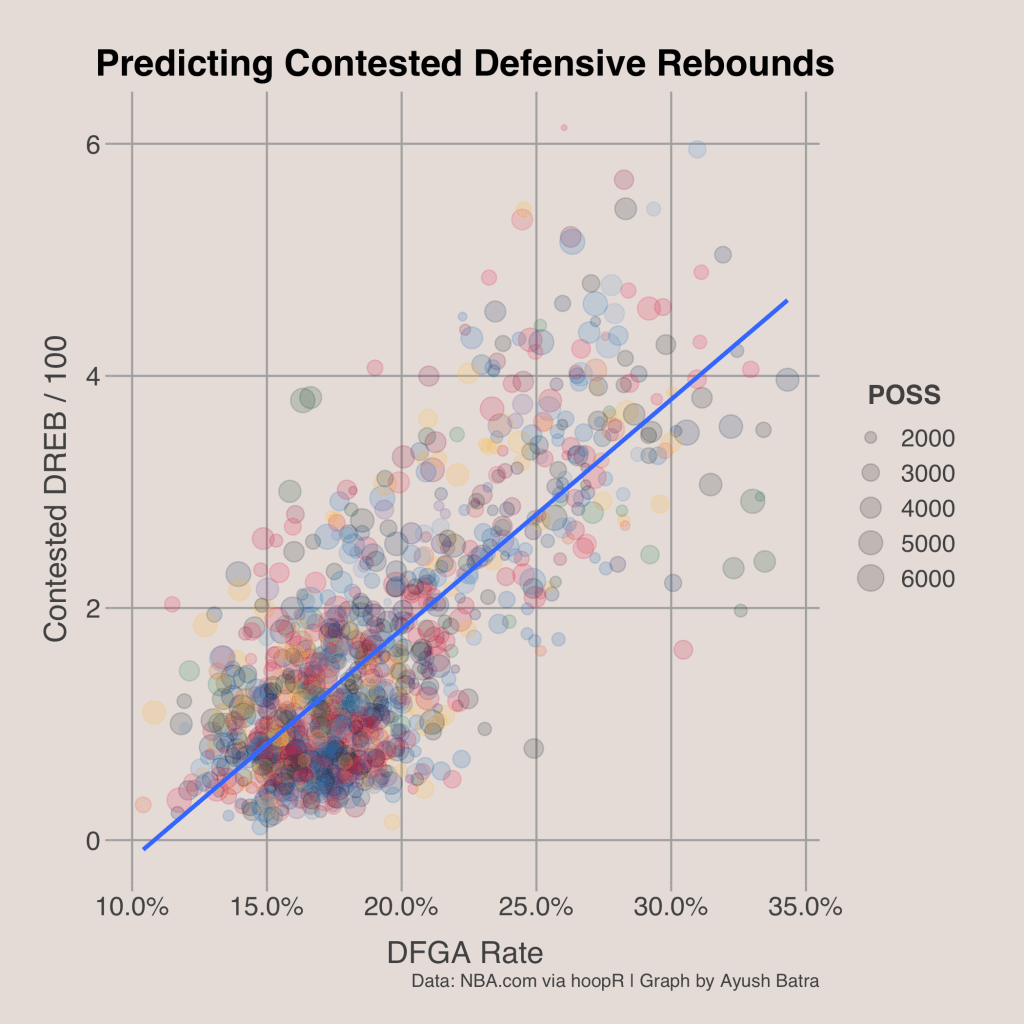
The output for the regression is shown below. Based on the coefficients, a player is expected to obtain 0.18 more contested defensive rebounds per 100 possessions for every 1 percentage point increase in DFGA Rate and 0.04 more for every 1 percentage point increase in frequency of DFGA at the rim. This does account for a large portion of the variability in contested defensive rebounds and will therefore help to find which players are actually rebounding better than expected.

The formula for Rebounding TDPM, the rebounding component of Tracking Defensive Plus Minus, is very similar to the formula for Turnover TDPM. The impact of defensive rebounding is found by taking the contested defensive rebounds over expected and multiplying by -0.5 and the league average points per possession. The coefficient of 0.5 allows us to limit the impact of defensive rebounding further, because if there is no coefficient it actually becomes more important than both shot defense and forcing turnovers, which is unrealistic. The best defensive rebounders in 2022 according to Rebounding TDPM have been Andre Drummond, Nikola Jokic, and Kevin Love.

Best Defensive Players of 2022
Using the formulas for each component of TDPM then adding them all together, I found each player’s defensive impact. The total Tracking Defensive Plus Minus can be interpreted as the impact the player has on his team’s defensive rating (points allowed per 100 possessions) when he is on the floor compared to the average NBA player. For example, Matisse Thybulle, the best defender this season at this point, has a TDPM of -6.55, meaning that the 76ers’ allow about 6.55 points fewer per 100 possessions when Matisse Thybulle is on the floor than if they had a league average defender. The current top 10 defenders in the 2021-22 NBA season are shown below.

Each of the players in the top 10 is really good in at least 2 of the 3 categories listed. The guards that are in the top 10, including Thybulle, Bruce Brown, and Caleb Martin, are all allowing far fewer field goals than expected and have been wreaking havoc by forcing lots of turnovers. It is important to note, though, that DFGPOE fluctuates a lot from year to year for guards since perimeter shooting percentage is more dependent on the ability of the shooter than the defender.
The best defense in the NBA so far has belonged to the Warriors. They allow 103 points per 100 possessions, which is far better than the league average of 110. We can see who has contributed to this success the most using TDPM.
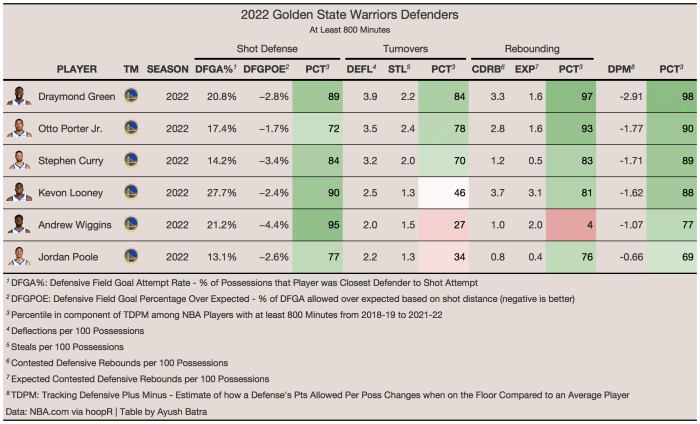
As expected, Draymond Green leads the Warriors’ top ranked defense. Draymond Green has ranked in 89th percentile or better of TDPM in every season since 2019. He has also consistently ranked highly in all 3 facets of defense, giving him his all-around defensive reputation. Kevon Looney and Otto Porter Jr. have been positive defenders for most of their careers, but Andrew Wiggins and Steph Curry seem to be benefitting from luck on shot defense. Wiggins and Curry rank in the 95th and 84th percentile of Shooting TDPM this season respectively, far greater than their career averages of the 63rd and 61st percentile respectively. With strong seasons from Curry and Wiggins in addition to the continued dominance of Draymond Green defensively, opponents will have a difficult time scoring against the Warriors.
Lastly, here are the Tracking Defensive Plus Minus’s for each player on the NBA First or Second All-Defensive Teams in 2021 and 2020.


Almost all of the defenders that made the All-Defensive teams in the past two years have deserved their place. The only exceptions are 2021 Kawhi Leonard and Jrue Holiday, both of whom suffered from unlucky seasons in shot defense (both of their career average percentiles in Shooting TDPM are close to the 60th percentile). Each of the guards that made these teams helped their defense by both contesting shots and getting lots of deflections, disrupting their opponents’ offense. It is also true that having a good defensive reputation, like Jrue Holiday and Kawhi Leonard, really helps when allowing more field goals than expected. Additionally, these defenders are likely better than their TDPM indicates since they consistently guard their opponents’ best players, making it even more difficult to stay efficient on the defensive end. Tracking Defensive Plus Minus is a new, more advanced, and more accurate way to judge player defense as opposed to common box score statistics like steals and blocks.
