

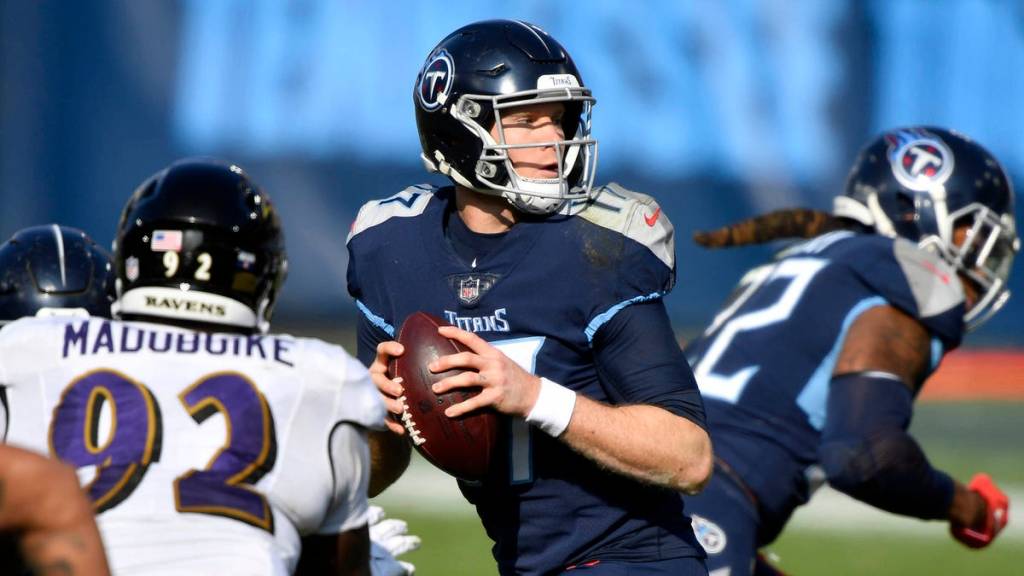
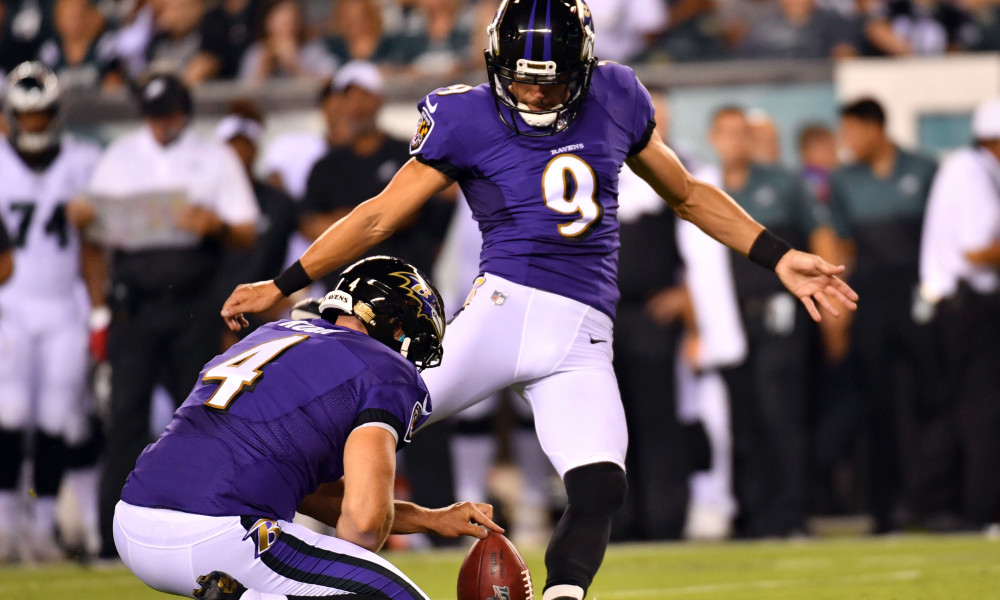
Two weeks ago, the Tennessee Titans faced off against the Baltimore Ravens in an AFC wildcard matchup, where one single play calling decision could have changed the outcome of the game. After Titans’ quarterback Ryan Tannehill threw an incomplete pass towards tight end Jonnu Smith on 3rd & 2 from the Ravens’ 40 yard line, a huge 4th & 2 decision arose. The Titans were down 13 to 17 with only 10 minutes remaining in the game, and the Ravens had just come off a drive in which they missed a field goal. The decision of whether to punt, kick a field goal, or run a play was crucial. Ultimately, the Titans opted to punt the football away, after which the Ravens scored a field goal on a 52 yard drive that milked over five and a half minutes off the clock. The Titans would go on to throw an interception on their next drive, leading to their elimination in the first round of the playoffs.
The 4th & 2 play in that Titans game is just one example of how fourth down decisions can change the outcome of a game. Had the Titans gone attempted the fourth down and converted, they would have had an opportunity to score a touchdown and take the lead, which could have eventually gotten them a win. Fourth down decisions are some of the most important plays of games, so NFL teams need a guide on when to punt, when to kick a field goal, and when to go for it on fourth down. Using expected points, fourth down conversion probability, and field goal probability, the optimal decision for any down and distance scenario on fourth down can be found.
Expected Points
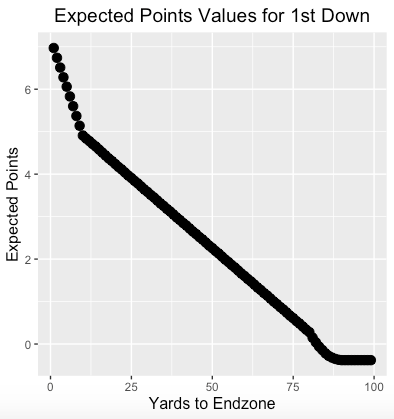
The way that I found the best decision for each fourth down scenario was by using the expected value of the expected points after punting, kicking a field goal, or running a play, then comparing the values. Expected points are an advanced football stat that “estimate the expected number of points given a combination of down, distance, and yard line.” Using the expected point values from pro football reference, I could give a point value to each possible down and distance.
Punts
The most common fourth down decision is punting. Teams most often punt when they have not crossed mid field and want to avoid gifting their opponents good field position.
I calculated the expected value for the expected points after a punt play by using a regression of the expected points after a punt for a random sample of 1000 punts from this past NFL season. The overall pattern of expected points after a punt based on the distance from the endzone showed a curved pattern, so I opted to use a quadratic regression to smooth the results instead of a linear model.
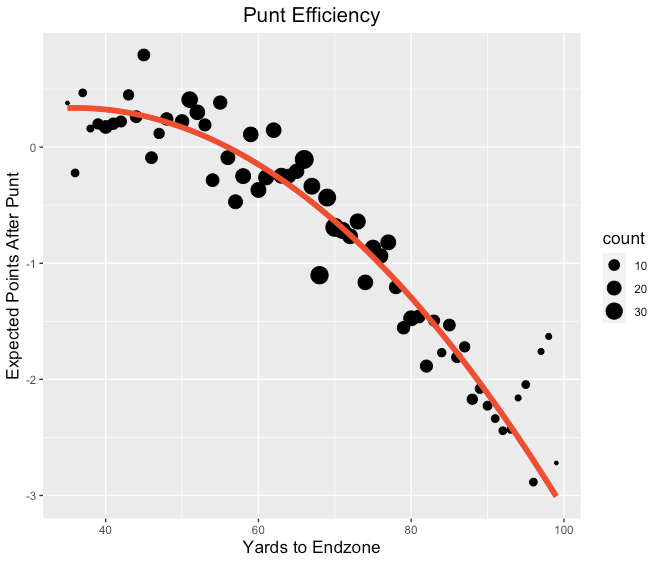
During the 2020 NFL season, no team punted the ball when they were within 35 yards of the endzone. As seen by the graph above, punts rarely give the punting team an advantage, as the only place where there is a positive expected points after a punt is within about 55 yards of the endzone. Even still, they provide a very small positive gain. However, while punting rarely gives a team an advantage, going for a fourth down and failing gives a huge advantage to the opposing team. Therefore, it makes sense that punting is optimal when a fourth down has a moderately low chance of being converted and the team is on their own side of the field.
Using the Titans’ 4th & 2 scenario from the Ravens’ 40 yard line, the Titans would have had an expected value of expected points equal to 0.32 for a punt, based on the quadratic regression. That is not very high, but it has to be used in comparison to the expected value of expected points for field goals and conversion attempts, which have not yet been calculated, to determine the optimal decision.
Something else that should be taken into account is the skill of the team’s punter. The graph above shows the average expected points after a punt for an average punter. Therefore, if a team has an especially good punter, like the Patriots with Jake Bailey or the Lions with Jack Fox, then the regression curve for the average expected points after the punt should be shifted slightly upwards. On the other hand, the curve should be shifted slightly downwards for teams with subpar punters, making going for a conversion a better option in some circumstances.

Field Goals
The outcomes of field goal attempts are binary, unlike punts, in that they are either made or missed. Therefore, the expected value of the expected points of field goal attempts had to be calculated in a different manner. First, the probability of making a field goal from the distance of a given attempt had to be found. Then, the expected value of the expected points was the sum of the probability of making a field goal multiplied by 3 (since the expected points of making a field goal is always 3) and the probability of missing a field goal multiplied by the opponent’s expected points with a 1st & 10 at the yard line they would have received the ball, times -1 because the ball belongs to the opponent.
Let’s use the fourth down situation from the Ravens-Titans game as an example. The situation was a 4th & 2 from 40 yards from the endzone. The probability of making a field goal that far from the endzone (a 58 yard field goal) is about 47%, based on the model shown below. The expected points for a field goal is always 3, and the expected points for a miss would be the Raven’s expected points for a 1st & 10 from their own 48 yard line multiplied by -1, which is -2.13. Therefore, the total expected value of expected points of a field goal attempt for that scenario is 0.47 times 3 plus 0.53 times -2.13, which is 0.28. The expected value of expected points for a field goal in the Titans’ situation was lower than the expected value of expected points for a punt (calculated in the previous section), although it was close. Therefore, they were right to not kick the field goal, so the decision was between a punt and a conversion attempt.
In the NFL, field goal distances do not match up with the yards to the endzone. For example, a field goal from the opponent’s 28 yard line is classified as a 46 yard field goal. This is because it accounts for the 10 extra yards included by the width of the endzone and 8 yards for how far back the kicker is behind the line of scrimmage. Shown below is the average field goal percentage for every field goal distance in a random sample of 1000 field goals during the 2020 NFL season. The red line represents the results of a logistic regression that estimates the probability of making a field goal from any given field goal distance.
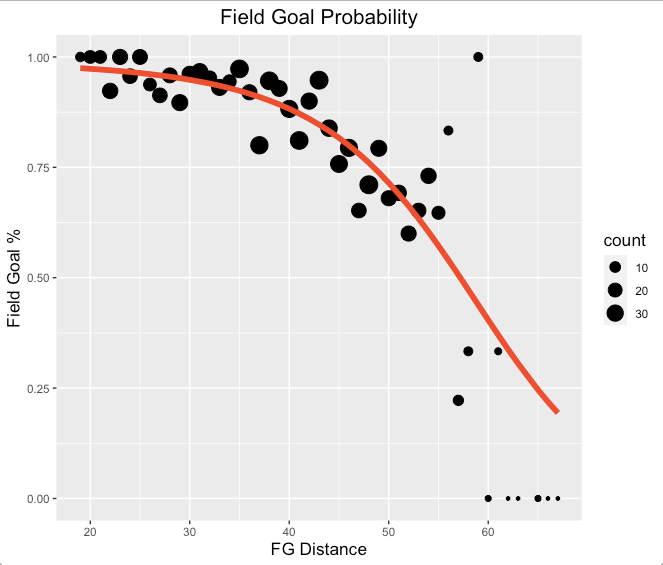
The probability of making a field goal for kicks within 50 yards is consistently above 70%, but after that the chance of making a kick falls significantly. Kicks that range over 60 yards have only about a 25% chance, on average, meaning they are not good risks to take unless a team is in a situation in which they need a kick to win the game. No kicker has ever made a field goal ranging longer than 64 yards, so I set the probability of making kicks longer than 64 yards to 0 since I do not believe kickers have a 20% chance at making a field goal from 70 yards and farther. After multiplying the chance of making the kick by 3 and adding it to the chance of missing the kick multiplied by the expected points after missing, the expected value for a field goal attempt in every down and distance scenario for fourth down could be found.

As seen from the graph, kicking a field goal has a positive expected value within about 40 yards from the endzone. However, after that it starts to become worse and worse, making punting or going for a conversion a better idea. Again, just like with the punting scenarios, a team with a really good kicker, like the Ravens with Justin Tucker, should shift the expected value curve upwards, making kicking a field goal a good option even when the attempt is in the high fifties.
Conversion Attempts
The last option for a fourth down is to attempt a conversion. It is the riskiest and least utilized option among NFL teams, mostly because the coaches are very risk averse, wanting to avoid giving up bad field position at the expense of a chance to continue a drive. The method for calculating the expected value of a conversion attempt was similar to the field goal method. First, the probability of converting a fourth down based on the distance to the first down had to be found. Then, the expected value was the sum of the probability of converting multiplied by the expected points for a 1st & 10 from the first down yard line and the probability of failing multiplied by the opponent’s expected points for a 1st & 10 from the spot they would have received the ball times -1.
Again, we can use the Titan’s 4th & 2 at the Ravens’ 40 yard line as an example. The probability of converting a 4th & 2 is about 62% based on the logistic regression below. The expected points of a conversion would the the expected points of a 1st & 10 from the Ravens’ 38 yard line, which is 3.05, while the expected points of a failure would be the expected points for the Ravens with a 1st & 10 at their own 40 yard line, multiplied by -1, which is -1.6. Therefore, the expected value of expected points for a conversion attempt was 0.62 times 3.05 plus 0.38 times -1.6, which comes out to be 1.28. Therefore, the Titans should have elected to run a play on fourth down rather than punt, as the expected value of expected points was 0.96 points greater for a conversion attempt than a punt.
Using all the fourth down attempts in which the offense ran a play, I estimated the probability of converting a fourth down using a logistic regression. Unfortunately, since teams don’t attempt conversions on fourth downs often, the sample size was very small and could be somewhat inaccurate, especially farther from the first down since fewer attempts occurred from greater than 10 yards away from the markers.
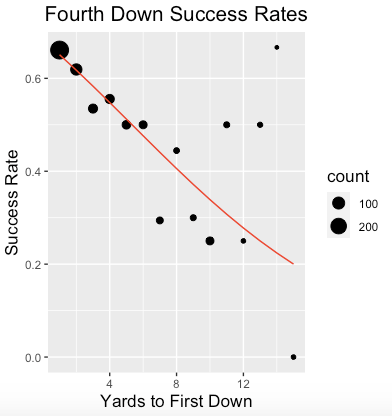
The chance of converting a 4th & 1 is about 65% on average. The chance of converting drops pretty consistently, as a 4th & 4 has about a 55% chance of being converted while a 4th & 8 has about a 40% chance of being converted. While the distance to the first down marker has little to no effect on punts and field goal attempts, it has a great effect on the chance of a conversion. Therefore, making a graph for the expected value of a conversion attempt based on field position is not as simple, since there is another variable included.
The distance to the first down is what makes the difference between a good fourth down conversion attempt and a bad fourth down conversion attempt. The swing in expected value from a 4th & 1 to a 4th & 15 is about 2 points in the middle 60 yards of the field. That difference decreases when a team is in the redzone, but increases when a team is inside their own 20 yard line.
Similar to the punts and field goals, a better offense should have the points above shifted upwards, since they would likely have a better chance at converting a fourth down attempt, while the opposite it true for bad offenses.
Fourth Down Chart
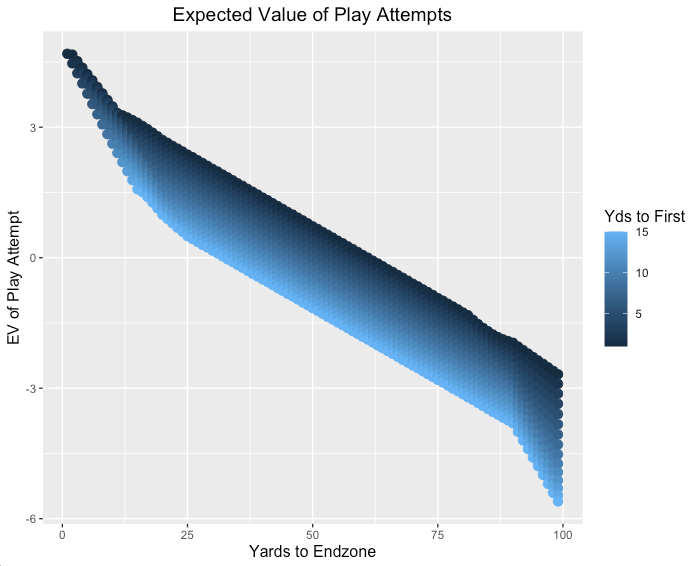
Using the expected values of the expected points after a punt, field goal attempt, or conversion attempt, the best options for a given fourth down situation can be found. The overlap of the expected value of the expected points graphs for each possible decision is shown below.
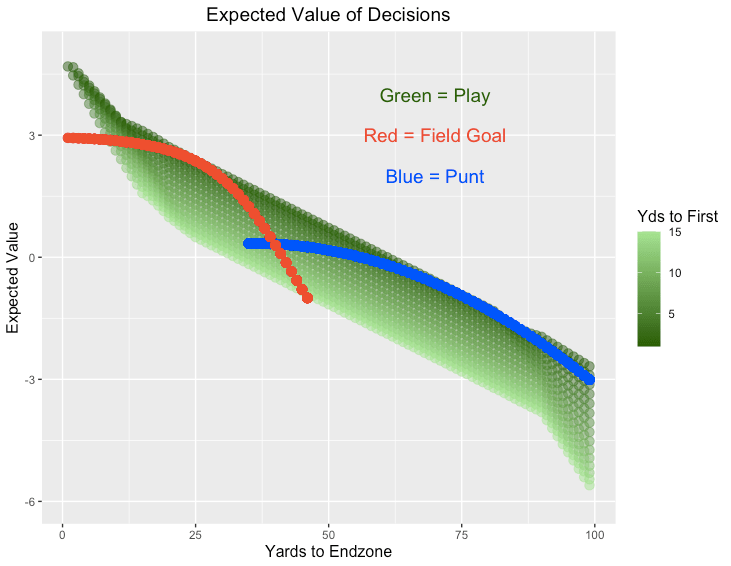
For the graph above, the distance to the first down only has an effect on a conversion attempt, which makes sense because a field goal on 4th & 1 from a given distance is the same difficulty for a field goal on 4th & 10 from the same distance. The same is true for punts.
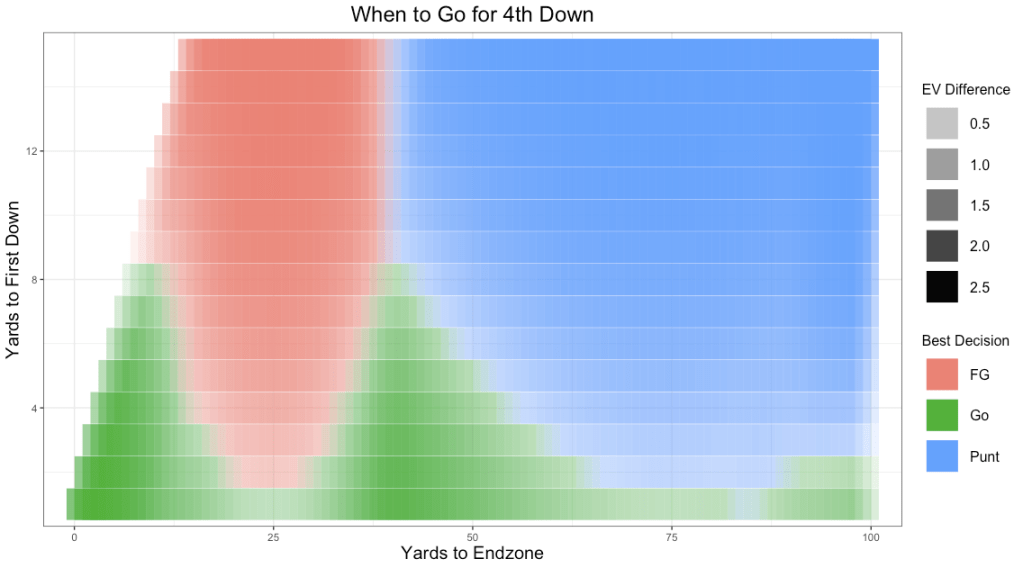
Since it is not always clear what the best decision is from the graph above, a more definitive graph is shown below, which gives the option with the highest expected value of expected points for fourth down situations within 15 yards to go to the first down from any distance.

In this graph, the more solid colored areas are the places where a certain decision has a more obvious benefit, whereas the lighter areas are the places where a decision is not as clear cut.
The first thing to notice is that there are two areas of the field where it is the most beneficial to attempt a fourth down conversion: goal to go situations and about 40 yards away from the endzone. Goal to go situations should almost never end in a field goal attempt when within 8 yards from the endzone, since the chance of converting and scoring a touchdown is very high and even a failure would result in extremely bad field position for the opposing team. From about 40 yards from the endzone, it is good to try to convert the fourth down since neither kicking a field goal or punting is a good option. Field goals in this area have a low probability, with attempts in the high fifties always have a less than 50% chance of being made. Similarly, punting does not provide much benefit since the other team receives the ball.
Meanwhile, the place where it is most optimal to kick a field goal is when a team is close to 25 yards away from the endzone, as field goals are almost guaranteed (about 85%) while conversions are not. With the exception of 4th & 1 opportunities, teams should almost always opt to take the points and kick the field goal. Additionally, as teams get backed up farther away from the endzone, it is a better idea to punt and not give up good field position. When there is a fourth down situation that is more than 8 yards away from the first down, it is almost always a better option to punt or kick a field goal. Teams should usually kick field goals within 40 yards from the endzone and punt if farther away, depending on the skills of a team’s kicker and punter.
In the places where the distinctions between an attempt and a kick are blurred, the situation surrounding a fourth down comes into play greatly. For example, if a team is leading by 6-8 points and is in a situation where a field goal and conversion are worth about the same, they should usually kick the field goal as a make would stretch the lead to two possessions. Similarly, if a team is trying to make a comeback, they need to take more risks and attempt fourth down conversions that are more difficult, as those types of plays have a greater variance and increase the chance of winning when behind.
As games go farther into the fourth quarter and become more situational, the fourth down chart becomes less useful. In late game situations, it is more important to take other variables into consideration – like the score, time remaining, and time outs left – that I could not take into account in this study.
Conclusion
The decisions that NFL play callers make on fourth downs often swing the outcomes of games, and optimizing the benefit of every fourth down decisions could result in a better chance of winning, just like the Titans could have if they made the most optimal decision. Using expected points and the probability of both conversions and field goals, as well as the average efficiency of punts, the best option for almost every fourth down scenario could be found. Punting, is a very inefficient play, usually resulting in a negative expected points, as it gives the ball to the other team. Field goals are efficient plays until the kicking distance gets close to 60, where it is difficult to make field goals consistently. Fourth down conversion rate depends greatly on the distance to the first down, so attempts of 1 yard have about a 65% chance of being converted but attempts of 8 yards have just a 40% chance.
The expected value of the expected points for attempting a conversion, kicking a field goal, or punting the ball, decided what the best option for a particular fourth down scenario. The optimal scenario that would maximize the average expected points gained for most scenarios is summarized in the chart below.
Optimal fourth down decision are many times the difference between a win and a loss, and the fourth down chart I created could help maximize the expected points in a given fourth down situation.

One thought on “Go For It?: A Guide to Optimal Fourth Down Decision Making”