
This college basketball season has been historic. Some teams that have had several games canceled because of coronavirus protocols, some teams that have not played a non-conference schedule, and some teams that have not even played at all. However, arguably the most notable storyline of this season has been the struggle of the blue bloods. Just 3 of the 15 college basketball programs with the most wins since 2010 are currently ranked: Gonzaga, Villanova, and Virginia. Notable blue bloods that are unranked include Duke, North Carolina, Kentucky, Kansas, and Michigan State. Some of those teams might not even make the NCAA tournament; Duke, Kentucky, and Michigan State are projected either outside the field or on the bubble for most bracketologists. Kansas went unranked for the first time in 231 weeks, Duke fell below 0.500 for the first time since 1999, and Kentucky is on track for their worst season since the 1920’s.
One of the possible explanations for the lack of success for traditional top tier programs in this weird season is their lack of experience. Duke and Kentucky frequently rely on five star high school prospects instead of older, more experienced players. Additionally, North Carolina, Kansas, and Kentucky have frequently relied on talented young players as well, although not to the extent of Duke or Kentucky. The theory is that these programs have struggled because of their low retention of players and interference of the pandemic with typical summer training, preseason, and exhibition games. This brings up a pressing question in college basketball: How important is experience in order to have success? Do experienced teams consistently perform better than inexperienced ones?
How Much Does Experience Predict Success?
Distribution of Experience
The first step in examining the effect of experience in the world of college basketball is to investigate the standard level of experience for the teams. For all of the graphs and charts included in this article, only teams from the six major college basketball conferences (ACC, Big 12, Big East, Big Ten, Pac-12, SEC) were included. I included only these select teams in order to avoid discrepancies in stats like win percentage and net rating because of strength of schedule. Teams from the six major conferences have schedules similar enough that comparing unadjusted net ratings will not have a huge effect. Unfortunately, some prolific teams like Gonzaga and Wichita State have been left out because of this. The sample includes these teams from the 2014-15 season to the 2018-19 season.
Experience in this article is calculated according to year in college. Freshmen have an experience of 0 years, sophomores have 1 year, juniors have 2 years, and seniors have 3 years. The average experience for each team is calculated by taking the average experience of their players, weighed by the number of minutes played during the season.
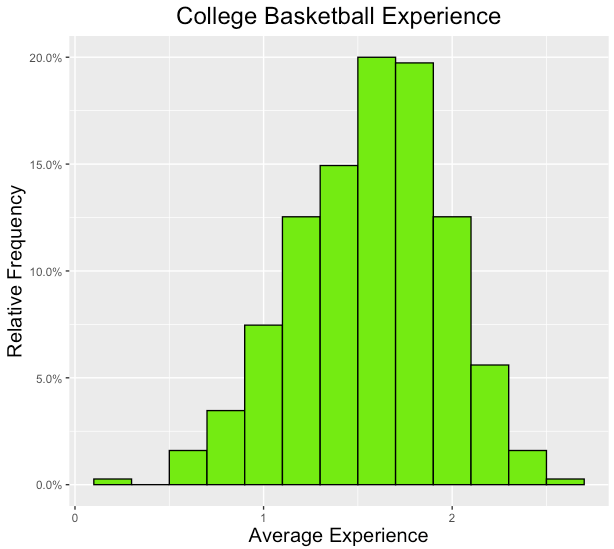
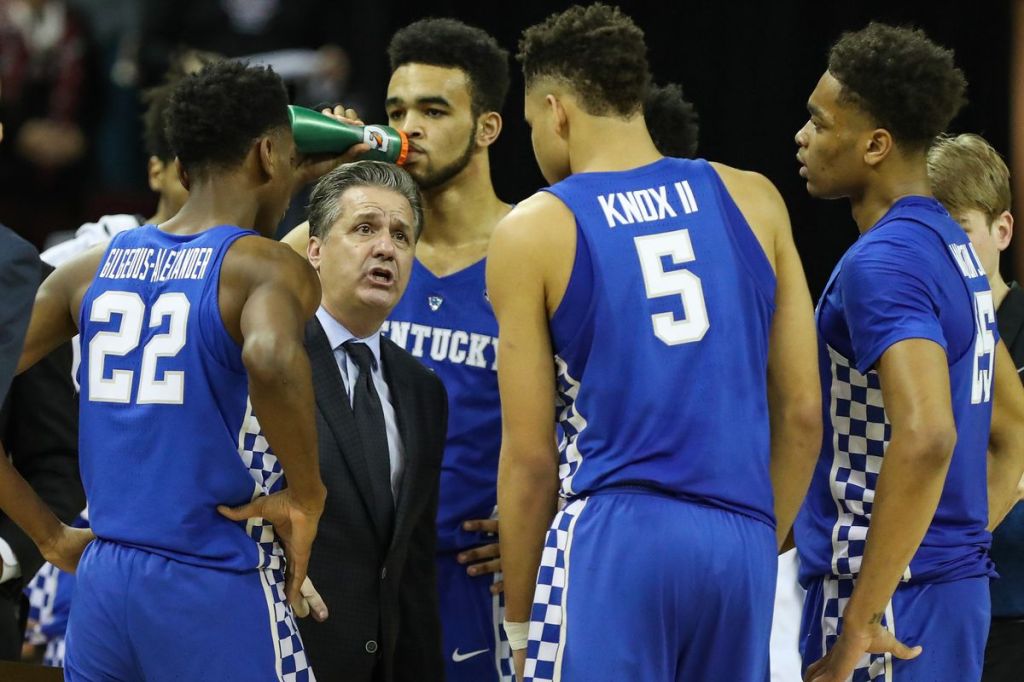
The distribution for average experience is roughly symmetric, with a very slight left skew. There was only one outlier: the 2017-2018 Kentucky Wildcats, with an average experience of just 0.19 years. That Kentucky team was led by a five freshman starting lineup (Hamidou Diallo, Shai Gilgeous-Alexander, PJ Washington, Nick Richards, and Kevin Knox) and had only one non-freshmen score above 5 points per game. The team had no juniors or seniors in their rotation, but they fared well enough, getting a 5 seed in the NCAA tournament and advancing to the Sweet Sixteen. On the other extreme was the 2016-17 Iowa State Cyclones, with an average experience of 2.51. Led by four seniors (Monte Morris, Deonte Burton, Matt Thomas, and Naz Mitrou-Long), the Cyclones also got a 5 seed but lost in the round of 32. Even though the Cyclones had the highest average experience, they were not considered an outlier. The mean of the distribution was 1.56 years, the median was 1.60 years, and the standard deviation was 0.39 years.
Effect on Offense and Defense
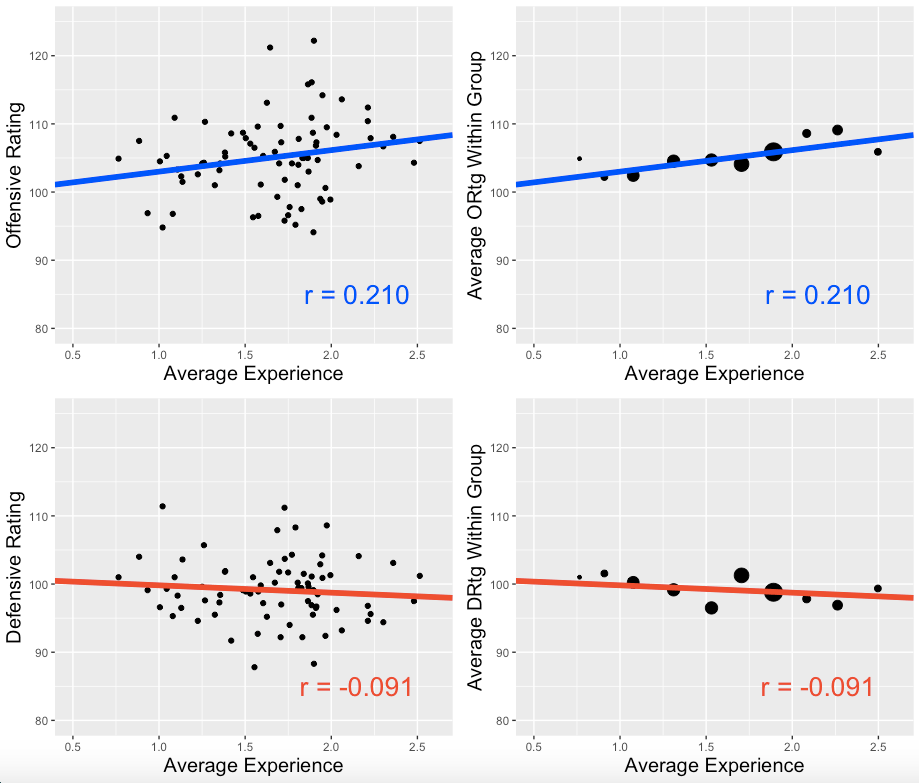
Now that we know the standard average experiences in college basketball, it is time to see how it affects offense and defensive performance. I attempted to show the relationship between experience and offensive/defensive performance with a few scatterplots.
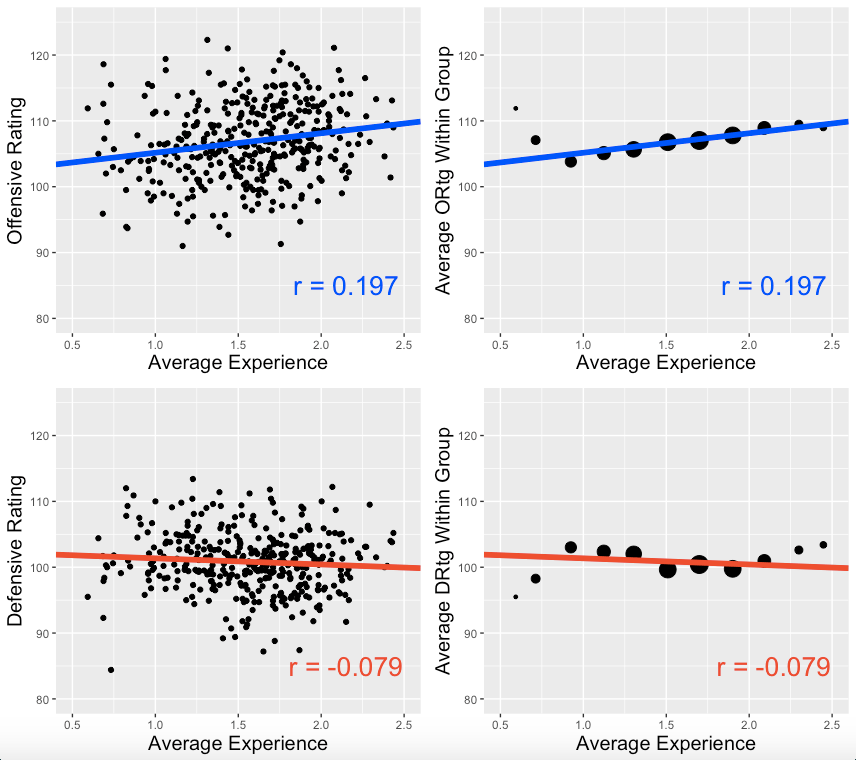
The average experience is shown on the x-axis of each scatterplot (outlier excluded), and the value for the offensive or defensive rating is shown on the y-axis. The left side shows a point, each representing one of the 374 teams included, while the right side shows the average offensive or defensive rating after grouping by each interval by every 0.2 years.
There is no clear relationship between experience and performance for offense or defense. However, there is a larger effect for experience on offensive performance, with a correlation coefficient of 0.197. While this is a low correlation, it does show that having a more experienced team should cause slightly better offense. Meanwhile, there is almost no relationship between experience and defense. With a correlation coefficient below so close to zero, defensive performance cannot be predicted by team experience.
Examining Total Performance
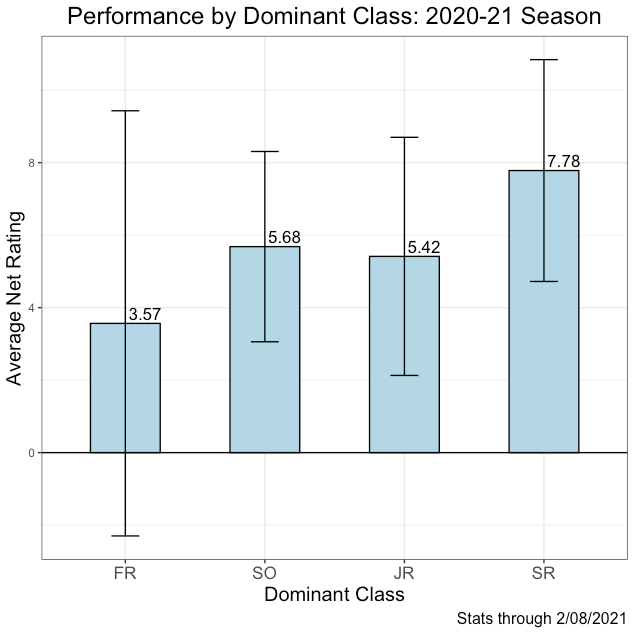
Another way of looking at the relationship between experience and college basketball performance is by grouping the teams into categories and analyzing the differences between the categories. Therefore, I grouped all of the teams included into one of four groups. Teams were classified based on which group of players (freshmen, sophomores, juniors, or seniors) had the most minutes on the team. After grouping all the teams, I took the average net rating of each group and found the standard error in order to see if the true means are significantly different among the groups. The results are shown below.

By looking at the height of each bar, it is clear that teams led by upperclassmen are better, on average, than teams led by freshmen or sophomores. However, the differences among the groups were not significant in most cases. You can clearly see that the margin of error for the sophomore, junior, and senior groups overlap. However, there is a significant discrepancy between the freshmen group and the senior group, and there is difference that is very close to significant between the freshmen group and junior group. Based on this graph, we can see that teams led by upperclassmen are significantly better than the teams led by freshmen, on average. Therefore, experience does have a statistical advantage, albeit a low one.
Can Experience Help Predict NCAA Tournament Runs?
While I was studying the effect of experience on the performance of college basketball teams, I began to think about whether it could help predict NCAA tournament success. Is it possible that more experienced teams make surprisingly long tournament runs more often? Maybe less often?
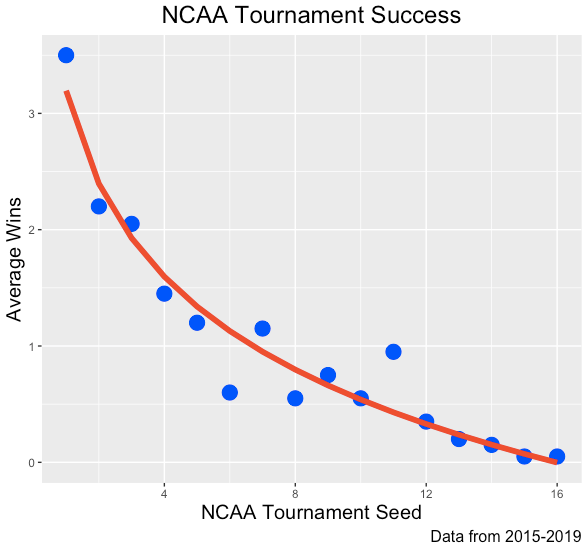
In order to quantify a successful or surprising NCAA tournament run, I looked at the relationship between NCAA tournament seed and tournament wins (not counting the first four). Using the red line shown below to predict the expected number of tournament wins based on seed, I found the most surprising runs by calculating the number of tournament wins over expected. The formula for the expected number of wins based on seed was 3.195 – 1.153 * ln(seed).
After finding the residual wins (actual tournament wins minus expected wins) for each team, I compared them to the teams’ experience.
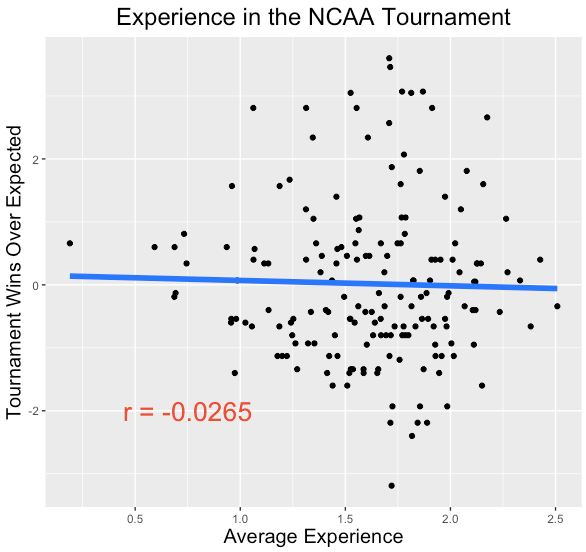
Unfortunately, the results did not show any type of relationship between experience and residual wins. With a correlation coefficient of -0.0265, there is essentially no correlation between experience and residual wins. Therefore, experienced teams do not have any type of advantage over inexperienced teams in the NCAA tournament. This may be contrary to what some analysts think about college basketball, as sometimes they claim that a certain team will fare better in the tournament because they are more experienced. However, it is important to note that this sample includes only teams in major conferences. Therefore, we cannot conclude that experience has no effect on tournament success for mid-major teams.
College Basketball Experience in 2021
Now that we know the importance of experience in determining success, we can see if the 2021 college basketball season has boosted the importance of experience due to the unusual circumstances. First, we can compare the net rating to the average experience for all the college basketball teams this season.
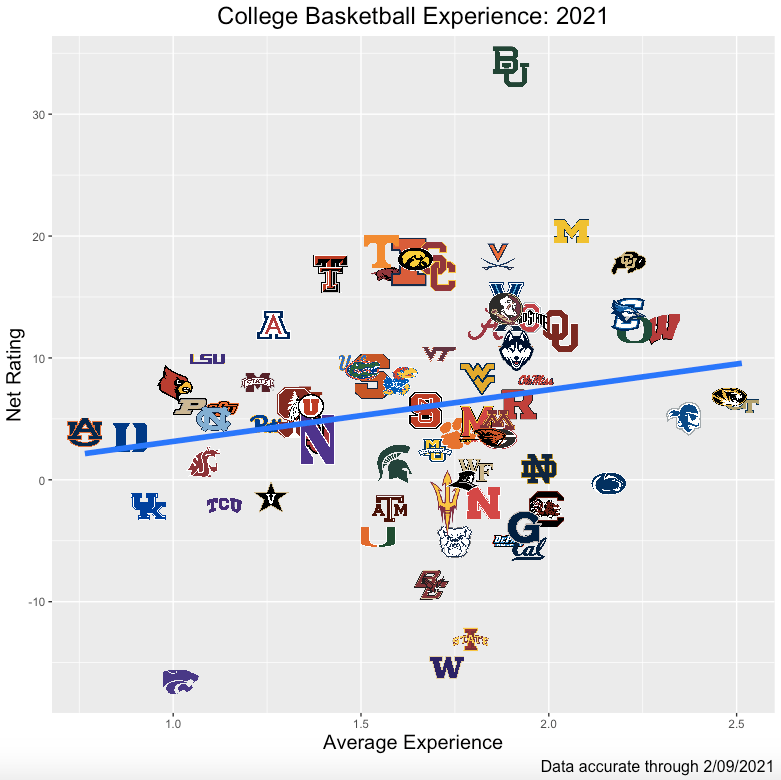
It is important to once again note that only teams from major conferences are included in the graph above. That is why the number 1 team in the country, Gonzaga, is not shown on the graph. By looking from top to bottom, we can see the teams with the best net ratings and the teams with the worst net ratings. Baylor stands alone at the top, with a net rating of 33.1. Baylor is led by mostly upperclassmen, including Davion Mitchell, MaCio Teague, and Jared Butler, with an average experience of 1.90. The worst teams are Kansas State, Washington, and Iowa State, but they vary in the amount of experience in their teams. The most experienced teams this year are Georgia Tech and Missouri. Both are led by upperclassmen and have average net ratings. However, there is still not a strong relationship between net rating and team experience. The same is true for offense and defense in relation to experience.
The relationship between offense and defense is similar to other seasons. There is still a low correlation between performance and experience, with offense being more correlated to experience than defense. The correlation between performance and experience is only slightly higher than in previous seasons. The most experienced teams are still expected to have an offensive rating about 6 points greater than the least experienced teams, and they are still expected to have a defensive rating about 2 points lower than the least experienced teams.
Looking at the performance by group gives similar results to the previous years. Obviously, the margin of error is greater for a sample of only this season as there are fewer teams included, leading to no significant differences among any of the groups. However, the teams led by seniors still perform better, on average, than teams led by freshmen. Five of the 8 major conference teams with the greatest net ratings are led by seniors this year. In contrast, the best team based on net rating led by freshmen is Arkansas, placing 9th among major conference teams. The only major difference from previous years is that teams led by sophomores have a better average net rating than teams led by juniors this season, although it is not close to a significant result.

Conclusion
This college basketball season has been anything but normal. The traditional programs have not been able to win at their usual rate, but experience is probably not the reason for their struggles. The correlation between offensive performance and experience is very low, but the correlation between defensive and performance is lower. However, it is true that teams led by upperclassmen perform better, on average, than teams led by freshmen or sophomores. The average net rating for teams led by seniors and juniors are significantly greater than those for teams led by freshmen. Even though more experienced teams are slightly better, on average, the advantage is not a lot. Therefore, we can conclude that experience is not the reason that the traditional blue bloods have have bad seasons. While Duke and Kentucky have disappointed while having some of the least experienced rosters, their actual net ratings are still pretty close to the average. Because experience does not have a large effect on team performance, we can conclude that having overall talent is much more important than having an experienced roster.

All the hysteria certainly affected.
LikeLike