
Fourth downs are one of the most intense situations in all of football. A fourth down conversion or failure can change the outcome of a game. Just look at last week’s Ravens vs Chiefs game, for example. The Ravens were faced with one of the most difficult decisions in football: go for a 4th & 1 at round midfield with less than a minute in the game while leading by 1 and risk giving Mahomes the ball with time and positive field position, or punt the ball and hope that Mahomes won’t get into field goal range if pinned back deep? The Ravens chose the former, allowing them to seal their victory as Lamar Jackson ran for the conversion, capping off an upset win. While it may have seemed like a difficult decision at the time, the Ravens understood the analytics behind their play: The chance of converting a 4th & 1 is above 70%, so it was more likely that they would win with a conversion than lose with a failure. Meanwhile, the chance of winning after a punt would have been far less since the Chiefs needed only a field goal to win, making the decision an obvious one for them (all of this doesn’t even account for the fact that one of the greatest quarterbacks in NFL history was playing for the other team).
This late-game scenario provides some evidence for the importance of fourth down aggressiveness in NFL games. Fourth down decision making is one of the most crucial jobs for an NFL head coach, and the statistics show that being aggressive throughout the season on these situations can allow an offense to improve its efficiency.
Expected Attempt Rate
In order to determine which teams are the most aggressive on fourth down, I decided to look at the Fourth Down Attempt Rate for each team. The Fourth Down Attempt Rate is simply the percentage of fourth downs that a team ran an offensive play on as opposed to a field goal or punt. However, there is a major flaw with this approach: it does not take situation into account. Therefore, I used a different method. First, I filtered out specific situations in which fourth down decision making is particularly volatile: this includes when the absolute score differential is greater than 16 (more than a 2 possession game) or when there is less than 1 minute remaining in the half. In situations where the score differential is large, some teams will choose to go for more 4th downs in order to try to increase their win probability, whereas other teams give up and choose to punt because they feel a conversion will not change the outcome of the game. When there is less than 1 minute remaining in a half, teams will sometimes go for 4th down more in order to increase likelihood of scoring whereas others will punt more to ensure that they do not give the opposing team an advantage with little time remaining.
Then, I had to determine the probability that a team goes for a 4th down based on the situation — yards until first down, score differential, time remaining in the half, distance from the endzone, and scoring circumstances. You might be asking, what are scoring circumstances? Well, the fact is that teams often determine their fourth down decisions based on the exact score differential. For example, when a team is down 3 points, they will most likely kick a field goal if they are in range because a make would cause the game to be tied. On the other hand, if a team is down 4 points, they are more likely to go for a 4th down instead of a field goal because the team needs a touchdown to take the lead; kicking a field goal would not help them very much, since even with a make they would still be down 1 point. Therefore, the effect of score differential on 4th down attempts would not be linear, or any normal graphical shape for that matter because of the nature of NFL scoring rules.
The best way to solve this problem was to use dummy variables. I created 3 different dummy variables for particular scoring scenarios. The first is when the score differential is at a place where a made field goal would cause the game to go from a 1 possession game to a 2 possession game (if leading) or a 2 possession game to a 1 possession game (if trailing). I called this variable, “change_poss_lead.” A 1 possession game occurs when the score differential is within 8 points, since a touchdown by the trailing team could cause a lead change. Therefore, the “change_poss_lead” dummy variable took on a value of 1 whenever the score differential was between -11 and -9 or between +6 and +8, and it was 0 in all other score differentials. The next dummy variable accounting for score situation was when a made field goal would push a lead from a field goal to a touchdown. This also included situations in which a field goal make would change the score so that a touchdown by the opponent would tie the game instead of give them the lead. This variable, named “get_td_lead,” was 1 whenever the score differential was between +1 and +5, and 0 in all other situations. Lastly, the final dummy variable was “take_lead,” which occurred when a made field goal by the offense would give them the lead or tie the game. Therefore, this dummy variable was active when the score differential was between -3 and 0.
To estimate the probability of going for a fourth down, I ran a logit model, with the results shown below, to predict a fourth down attempt based on the variables listed above in addition to some interaction terms using the dummy variables.
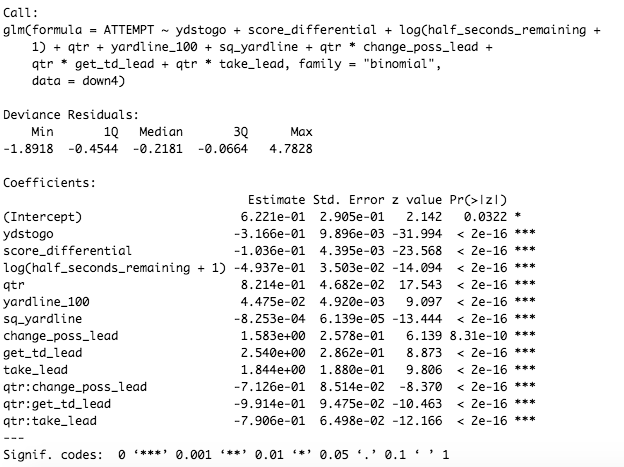
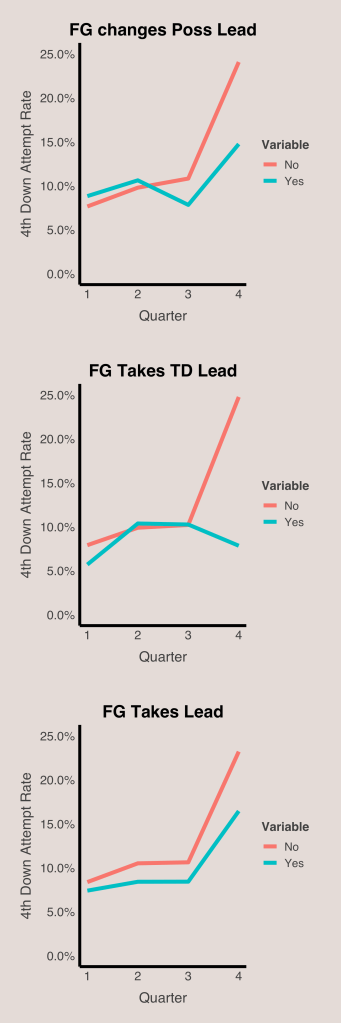
All the variable in the regression are significant, and the coefficients of the dummy variables and interaction terms are as expected. The interaction terms show that when there is a specific advantage to kicking a field goal instead of attempting a 4th down, teams will likely kick the field goal. These effects are far more present in the 4th quarter, though, as shown by the graphs below.
Most Aggressive Teams on 4th Down
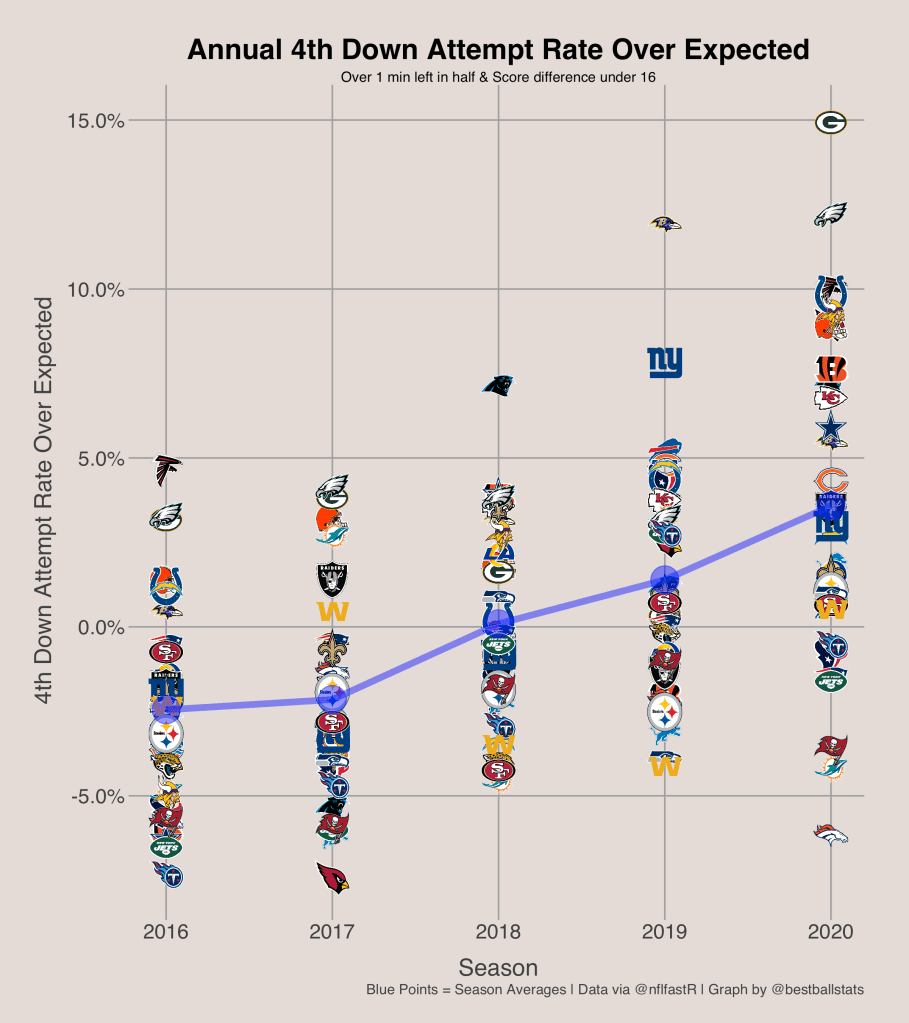
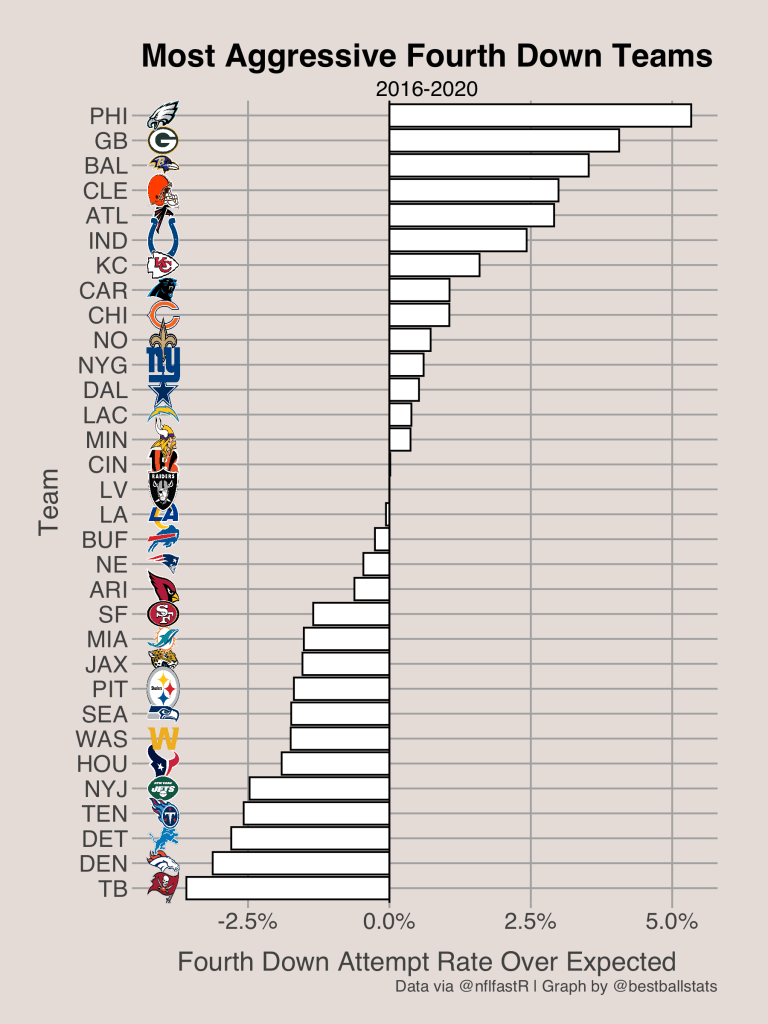
After calculating the probability that a team goes for a 4th down based on the logit model, we can find the most aggressive 4th down teams by finding those who go for it more often than expected. This is captured by Fourth Down Attempt Rate Over Expected. The graph below gives a quick summary of fourth down aggressiveness trends over the past 5 seasons. It is easy to see that 4th down aggressiveness is increasing league-wide, shown by the upwards trend of the blue dots (which are league averages for each season). Furthermore, we can see that in 2020, the Packers and Eagles were the most aggressive on 4th down, while the Broncos, Dolphins, and Buccaneers were the least aggressive. However, this graph only captures 4th downs when the absolute score differential was at most 16 and there was over 1 minute remaining in the half.
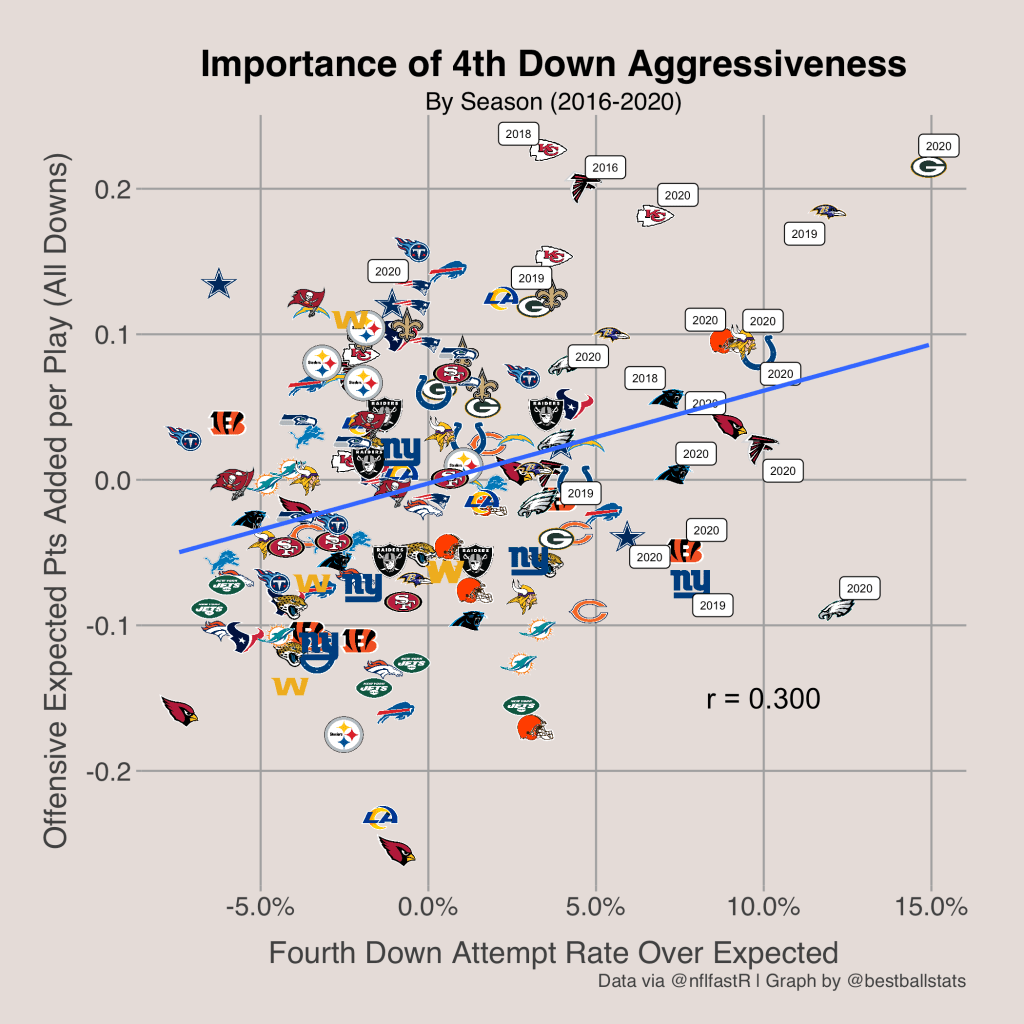
A quick look at the graph below gives some evidence that 4th down aggressiveness correlates with team success. For example, the 2020 Packers, 2019 Ravens, 2017 Eagles, and 2016 Falcons each made it to the divisional round or further after leading the league in 4th Down Attempt Rate Over Expected in their regular seasons.
The graph below shows the most aggressive teams on fourth down from 2016 to 2020 combined. The most aggressive 4th down teams have been the Eagles, Packers, and Ravens, while the least aggressive have been the Buccaneers, Broncos, and Lions.
The Importance of 4th Down Aggressiveness
Now that we know which teams are the most aggressive on 4th downs, we can see how that aggressiveness relates to offensive efficiency.
When investigating by season, it can be seen that 4th down aggressiveness has a moderate positive correlation (r = 0.300) to offensive EPA per Play. A full explanation of EPA can be found here, but the quick version is that it measures how much better an offense did than expected based on their situation on a per-play basis. It is possible that the causation runs in both directions, meaning that more fourth down attempts causes a higher offensive efficiency and a higher offensive efficiency causes more fourth down attempts. Nonetheless, a team with a Fourth Down Attempt Rate Over Expected of 10% was expected to have an EPA per Play around 0.07, which ranks towards the top of the NFL. However, the mean 4th Down Attempt Rate Over Expected is increasing, so the best-fit line does not apply to future seasons.
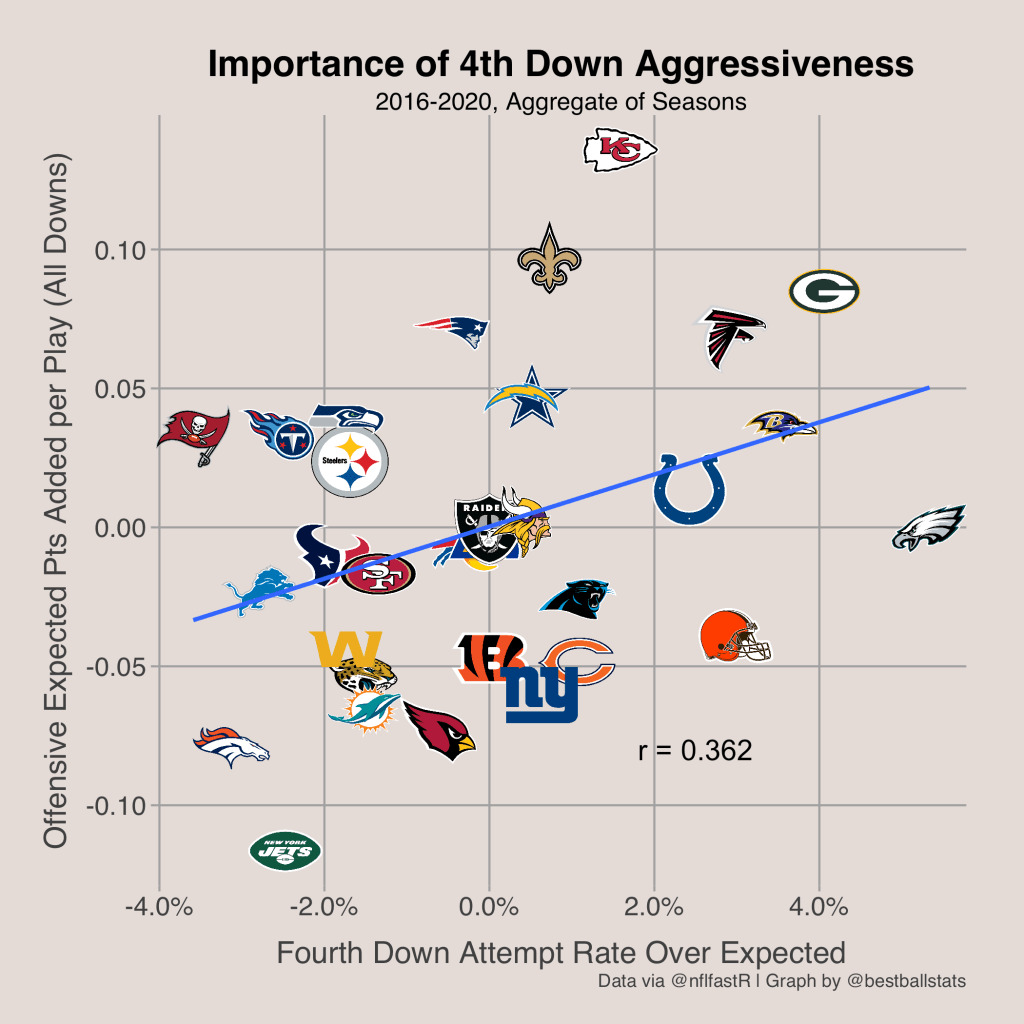
When taking a broader look, we see that 4th down aggressiveness still has a moderate positive relationship to Offensive EPA per Play. Again, although causation cannot be concluded from the correlation, more aggressive 4th down teams tend to be better offensively. This holds true for teams like the Packers, Ravens, Falcons, and Chiefs.
Teams like the Buccaneers and Titans, both of which are contenders for the Super Bowl, should increase their fourth down attempt rate and go for it more often, since this change in strategy could boost their offensive efficiency even further than it already is.
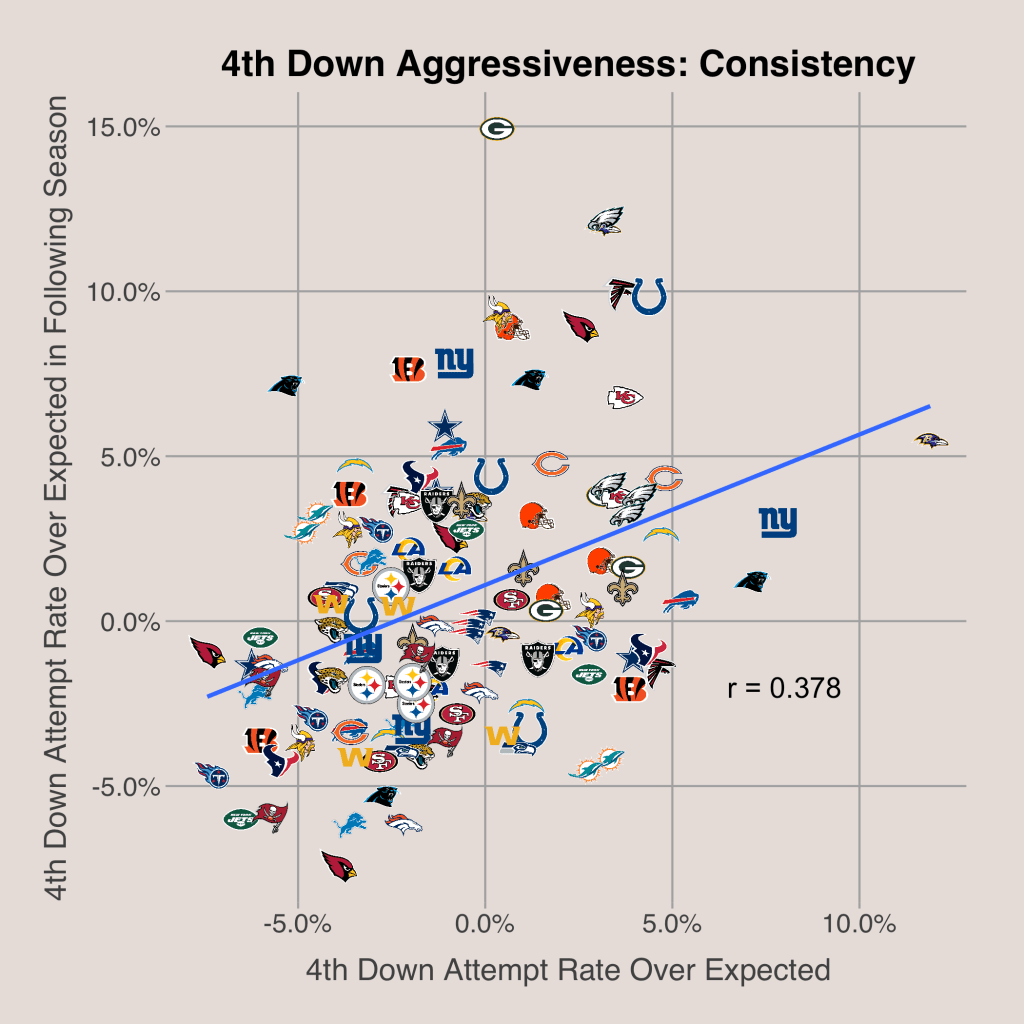
4th down aggressiveness is also a very consistent tendency. As seen by the graph below, there is a positive correlation between a team’s 4th Down Attempt Rate Over Expected in the current season and the next season. Additionally, it is easy to find clusters of the same team (like the Eagles, Steelers, Patriots, and Browns, to name a few), meaning that they are consistent about their fourth down tendencies. This does provide some evidence that 4th down aggressiveness causes better offensive efficiency because offensive efficiency varies more from year to year than 4th down aggressiveness.
2021 Stats: Who’s Taking the Most Chances
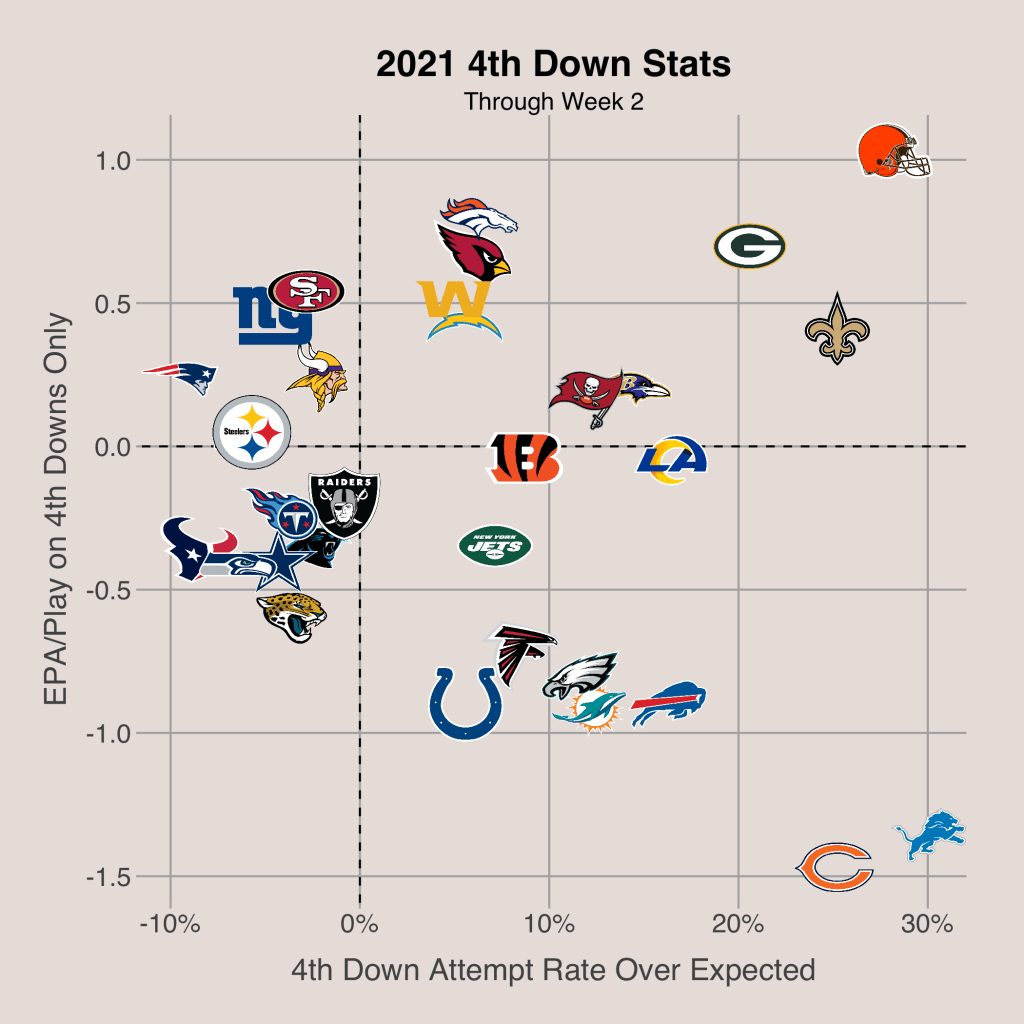
Now that we are a couple of weeks into the NFL season we can look at the aggressiveness of teams this year on 4th down. The most aggressive have been the Browns (who have historically been aggressive) and the Lions (Dan Campbell seems to be changing the culture since the Lions have historically been conservative on 4th downs). Although it is a small sample size, we already are seeing trends in 4th down decision-making, and these tendencies could change the offensive efficiency of a team.

One thought on “4th Down: How Aggressiveness Relates to Better Offensive Efficiency”