
Every season there seems to be a rookie quarterback sensation. Last season it was Justin Herbert, the year before was Kyler Murray, and the year before that was Baker Mayfield. Each of these players were being hyped as the next big time quarterback after one season of play. However, not all of these players lived up to their hype. Robert Griffin III, Marcus Mariota, and Carson Wentz each had impressive rookie seasons, but now none of them are on the team that drafted them. Meanwhile, some quarterbacks with poor rookie seasons, like Matthew Stafford and Josh Allen, have had successful careers. Since our thoughts about quarterbacks after their rookie years may not be all that accurate, we can find a likely range of possibilities for a quarterback’s career based on his rookie statistics, then apply them to the quarterbacks drafted in 2020 (Burrow, Herbert, Tua Tagovailoa, and Jalen Hurts).
Sample
The initial sample of players I used included all quarterbacks that were drafted (or went undrafted) in 2006 or later that had at least 100 passes in their first season of play. This sample was then filtered to only include players with at least 500 NFL pass attempts and 3 NFL seasons. I chose to use players drafted after 2005 because air yards, a metric that I will use in the final model, was first available in the 2006 season. The filters set on the sample of quarterbacks ensured that each player had an adequate sample of plays in both their first-year seasons and their careers. In total, the sample consisted of 43 players.
Methods
In order to quantify quarterback performance, I had to select a statistic I would use to rank quarterbacks. While passer rating is helpful and simple, it has many flaws, like giving all plays the same weight. Therefore, I opted to use expected points added (EPA) per play to rank the quarterbacks.
Expected Points Added accounts for the down and distance of a play. It gives a value for the expected points scored by the offense on a drive based on the down, distance to first down, and distance to endzone during a play. Taking the difference between the Expected Points after the play and the Expected Points before the play gives the Expected Points Added on a play. As said on ESPN, “EPA knows that not all yards are created equal.” If a team gains 5 yards on a 3rd and 10, they will have a negative EPA, but if they gain 5 yards on a 3rd and 1, the EPA will be positive.
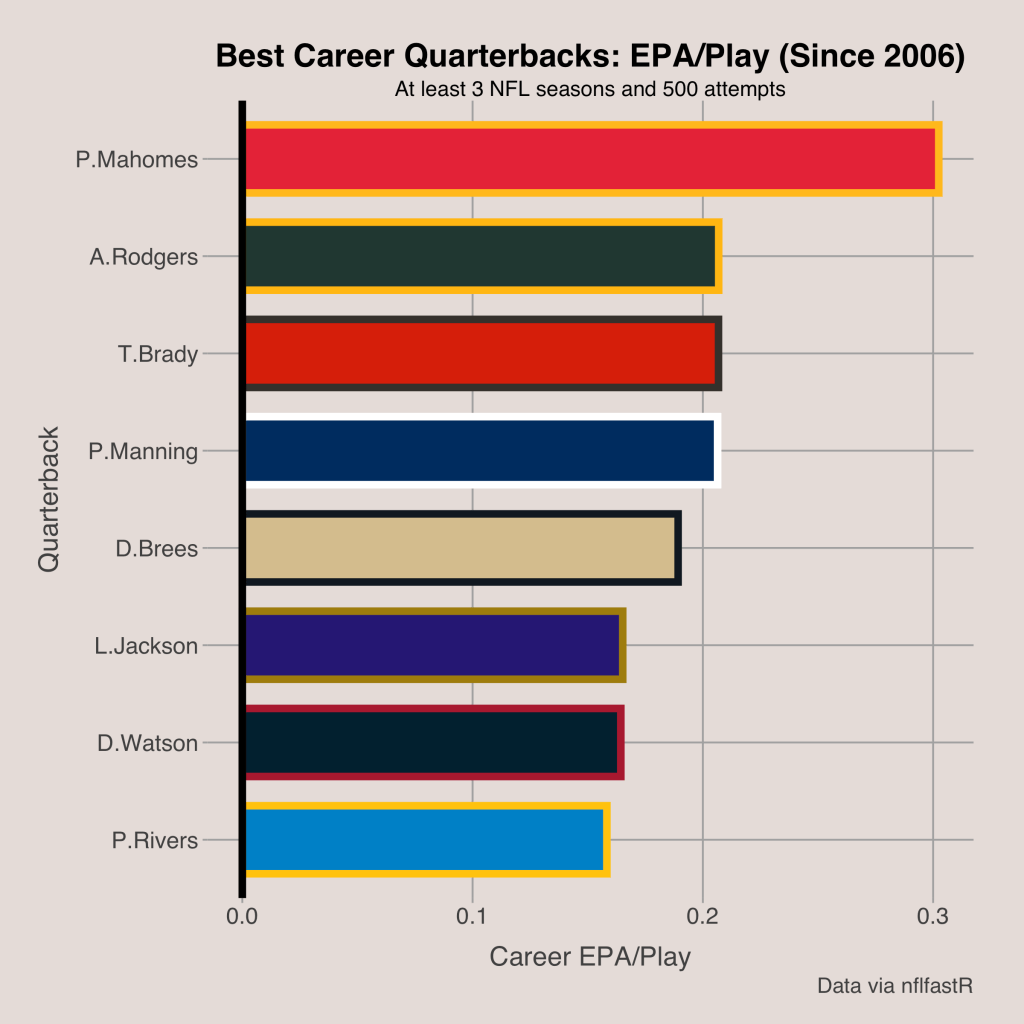
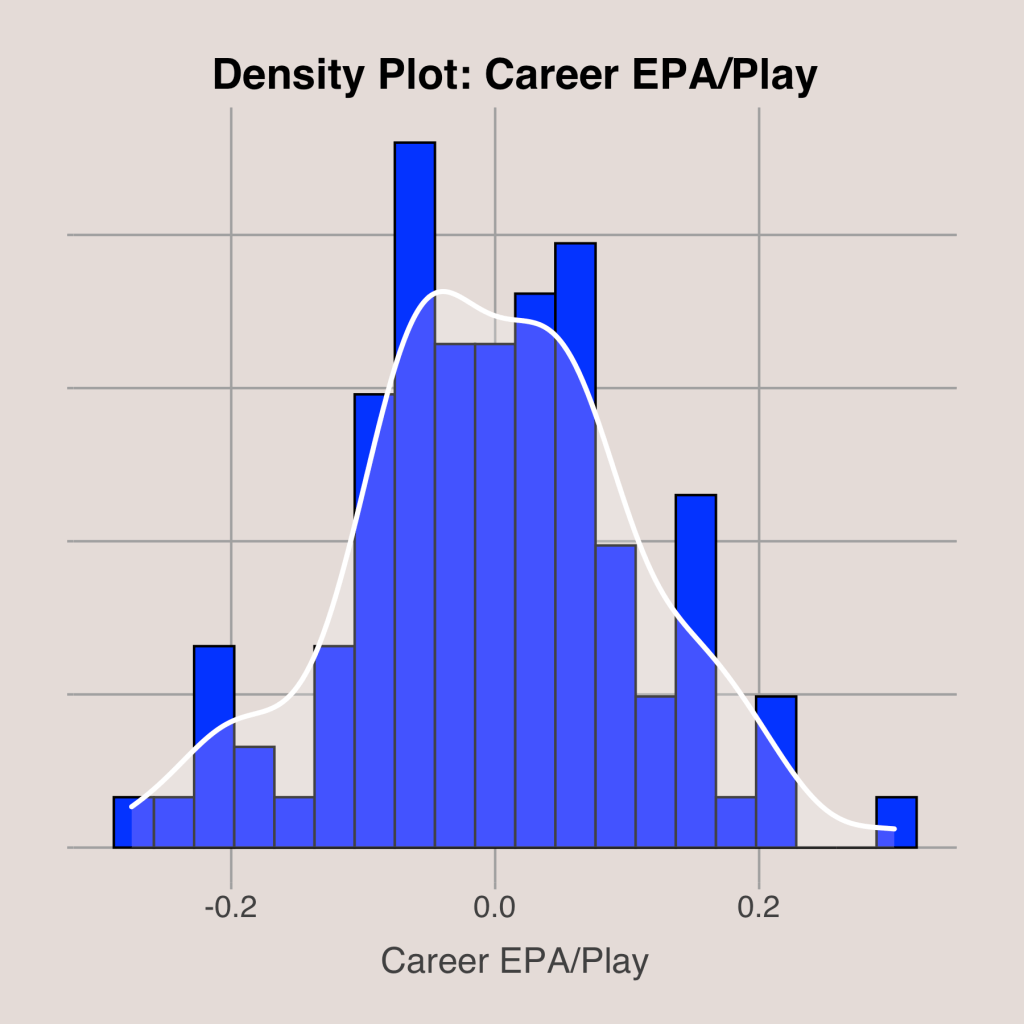
For reference, the top quarterbacks since 2006 ranked by EPA per play and a histogram of quarterback EPA per play are shown below. As seen from the rankings, EPA per play seems to rank quarterbacks relatively well. The distribution of EPA per play is approximately Normal with a mean of 0 and a standard deviation of 0.108.
Model
The goal of this project was to determine a quarterback’s career EPA per play based on his first-year statistics. Since there were only 43 players in the sample, I had to limit the number of independent variables I would use in any multiple linear regression to a small number. Therefore, I carefully chose my variables.
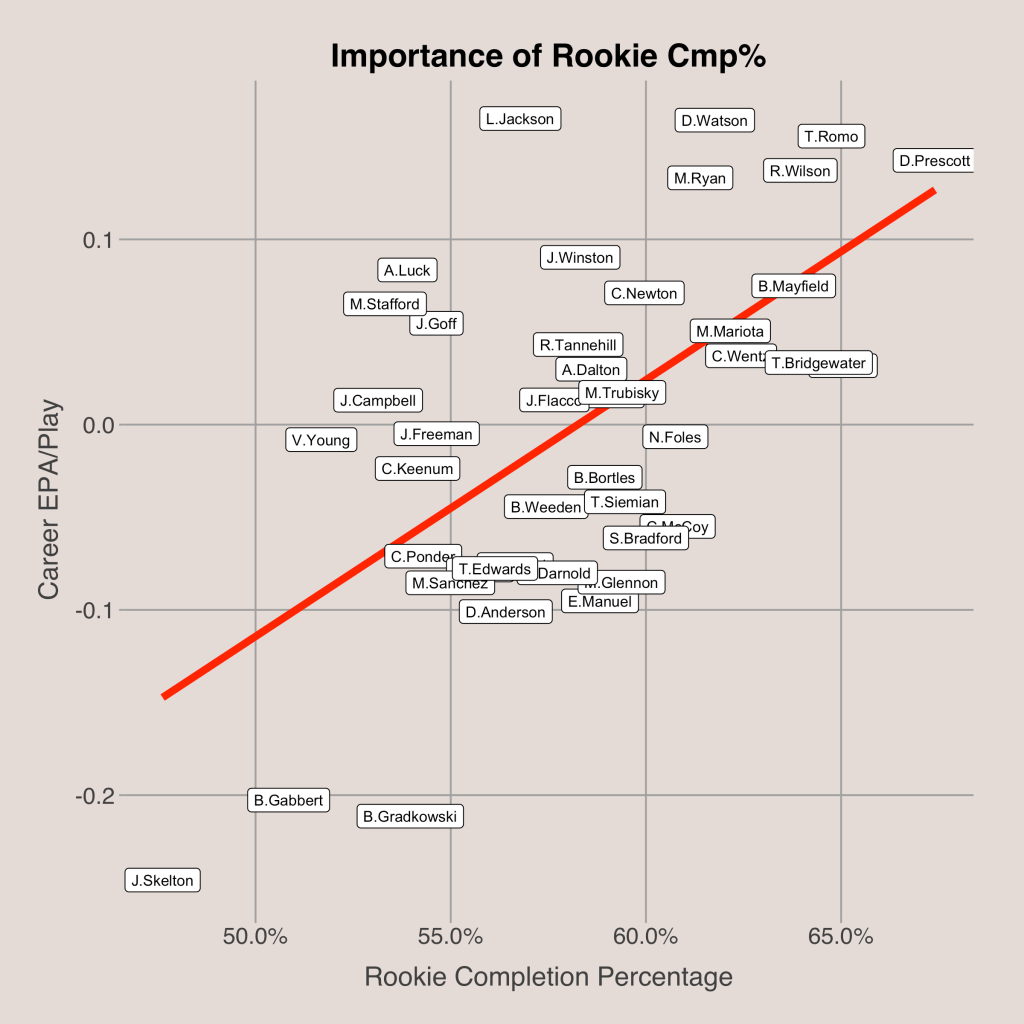
The first variable I included in the multiple linear regression was rookie completion percentage. Rookie completion percentage had a greater correlation to career EPA per play than rookie yards per attempt, touchdown rate, or interception rate. The correlation between rookie completion percentage and career EPA per play was 0.596, indicating a moderate positive relationship. Another interesting result was that rookie and career completion percentage (r = 0.702) had a higher correlation than rookie and career EPA per play (r = 0.679). For these reasons, I chose to use completion percentage as an indicator for passing ability, even though the statistic obviously has its shortcomings.
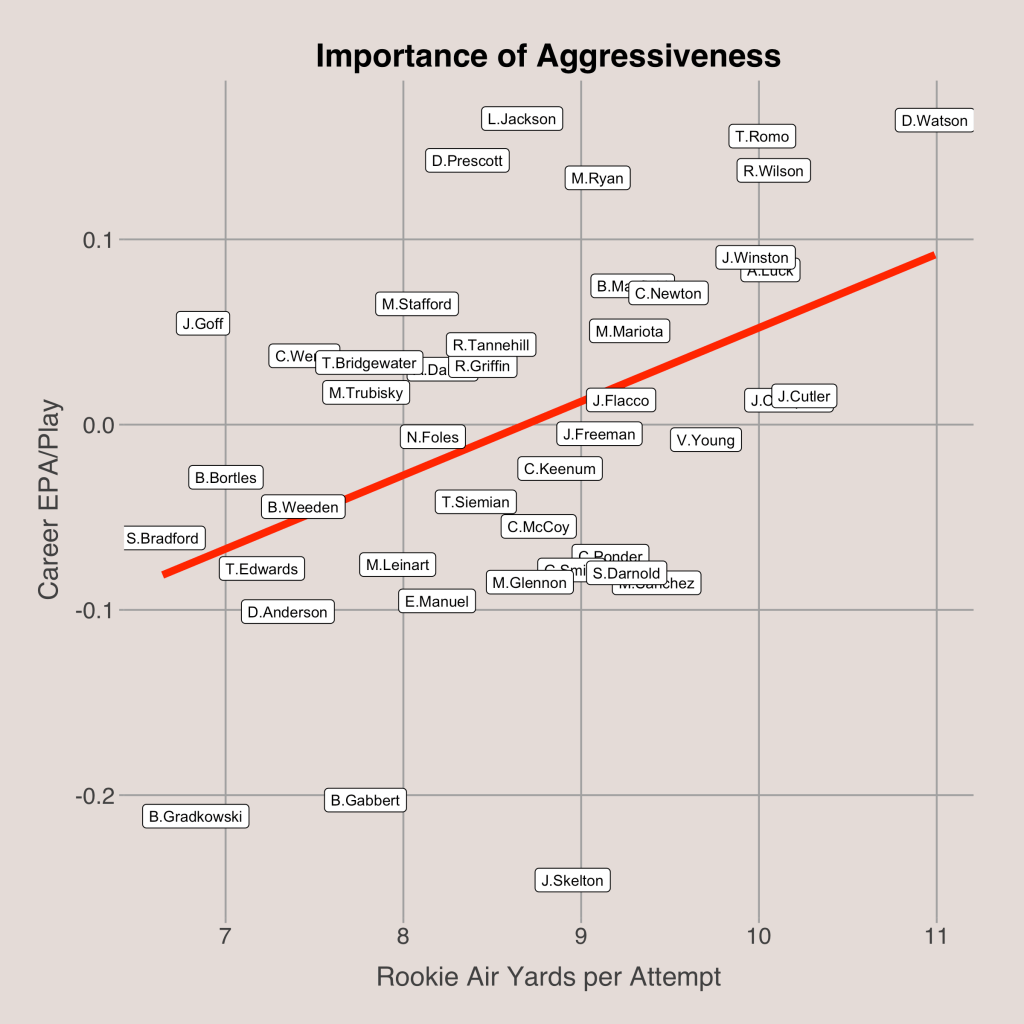
In addition to completion percentage, I added intended air yards per pass attempt as another independent variable to the regression. Intended air yards per attempt is the same as average depth of target. The average depth of target (aDOT) of a quarterback tells us how far, on average, he throws the ball downfield. From the scatterplot below, we can see that more aggressive quarterbacks, those with a greater aDOT, tend to have better careers.
I included two more variable in the multiple linear regression. The first was the natural log of draft pick. I included this variable in order to capture the overall talent of the player, since players that are picked earlier are more likely to outplay their rookie statistics. I took the natural log of draft pick because players picked later in the draft have less of a gap between them than players picked earlier For example, the 1st overall pick and 20th overall pick have a sizable gap in talent, but the 200th and 220th draft pick have a far smaller gap in talent.
The last variable was rush percentage. I defined Rush Percentage. as the number of rush attempts divided by the sum of pass attempts, rush attempts, and sacks. There was a positive relationship between rush percentage and career EPA per play, meaning that quarterbacks who run more during their rookie seasons tend to have greater success in their careers. One possible reason for this is that mobile quarterbacks who run more often are able to avoid sacks at a greater rate and pick up yardage by running when their receivers are all covered, both of which would increase their career EPA per play. Examples of players who had a high rush percentage as a rookie include Lamar Jackson (40.2%), Robert Griffin III (22.0%), Cam Newton (18.6%), Russell Wilson (18.0%), and Deshaun Watson (13.9%).
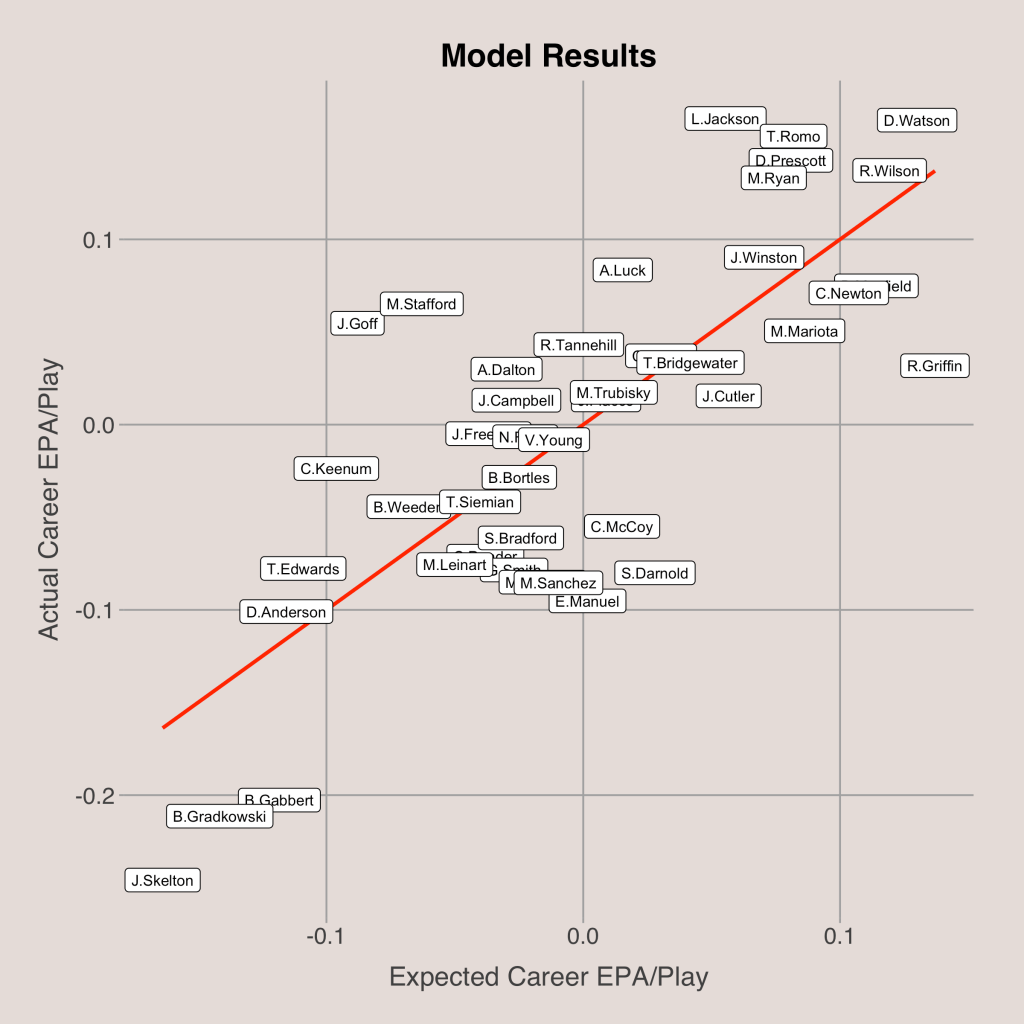
After determining the variables, I ran the final regression. The results are displayed below. The dependent variable was career EPA per play (EPA.car), while the independent variables were the natural log of draft pick (log(Draft_Pk)), rookie completion percentage (CmpP.rook), rookie average depth of target (AY_Att.rook), and rookie rush percentage (RushP.rook). Note that in the regression, the percentages were converted into decimals (so 40.2% would be entered as 0.402).
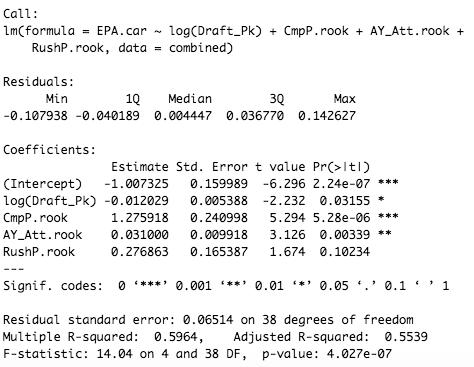
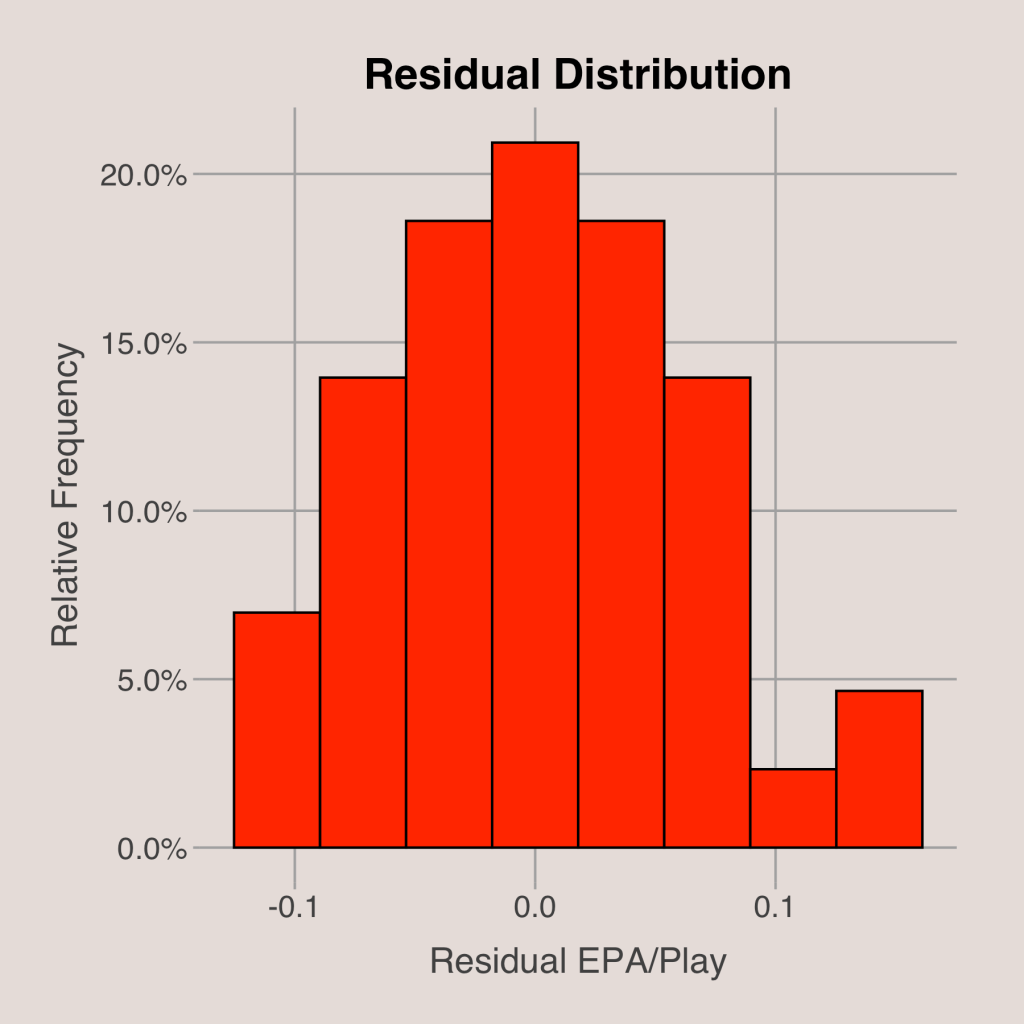
The most significant result was completion percentage, which was significant at all conventional significance levels. As for the other variables, average depth of target and draft pick can be considered statistically significant, while rush percentage was close but not quite. Still, adding rush percentage gave a greater adjusted r-squared, which was ultimately 0.554. The distribution of the residuals looked close to Normal, although there was a slight right skew. The standard deviation of the residuals was 0.0620.
Applying to 2020 Quarterbacks
Using the model specified above, we can make predictions for the careers of the quarterbacks drafted in 2020. Their projection would depend on their accuracy, aggressiveness, draft pick, and mobility in their rookie seasons. First, we can look at accuracy and aggressiveness by examining completion percentage and air yards per pass attempt. The stats for the quarterbacks drafted in rounds 1 through 3 who debuted in 2019 or 2020 are shown below.
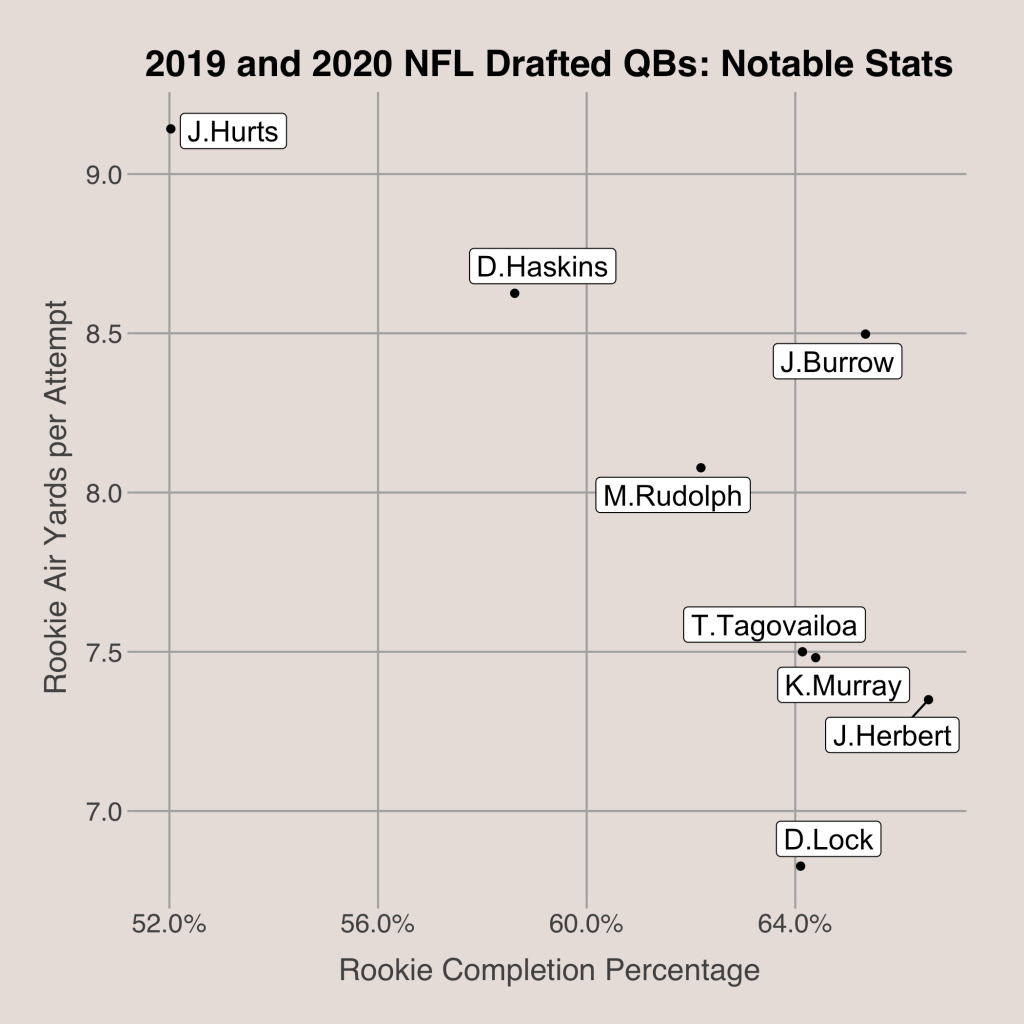
From the scatterplot, there is an obvious negative association between air yards per attempt and completion percentage. However, the player who stood out most was Joe Burrow. Burrow had a completion percentage of 65.3% and an average depth of target of 8.5 yards, meaning he accurate while still being aggressive. Justin Herbert, who had the best completion percentage of the players shown above, had an average depth of target more than a full yard less than Joe Burrow. In fact, Herbert’s average aDOT was the least of the 2020 quarterbacks drafted in the first two rounds. Meanwhile, Tua Tagovailoa had a good completion percentage with a low aDOT, while Jalen Hurts had a very, very low completion percentage with a very high aDOT.
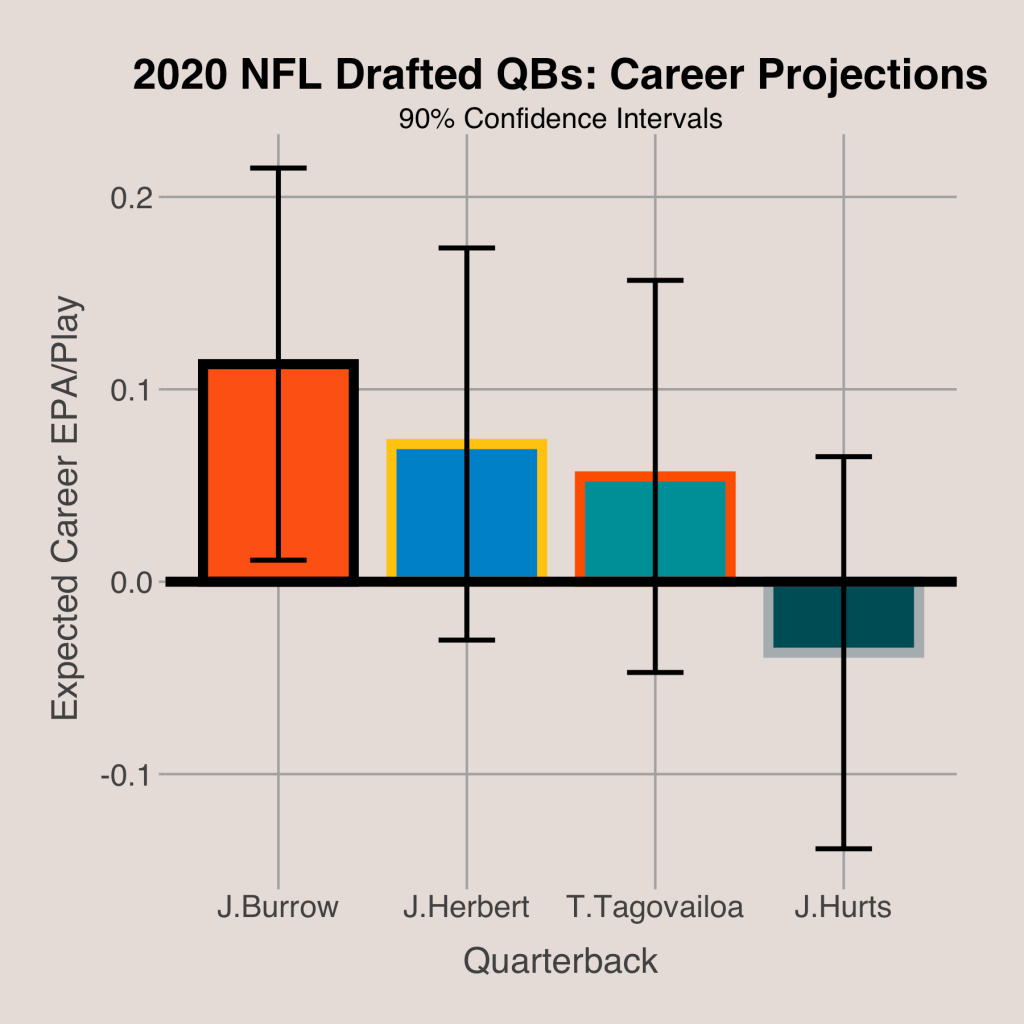
Draft pick and rush percentage are the other two variables in the equation. Joe Burrow was the 1st pick, Tagovailoa the 5th, Herbert the 6th, and Hurts the 53rd. Hurts was the most mobile, with a rush percentage of 25.6%, followed by Tagovailoa (11.0%), then Herbert (8.5%), then Burrow (8.4%). After applying the model to each of these players, the best predicted quarterback was Joe Burrow, with an expected career EPA/Play of 0.113. The confidence interval was found using the standard deviation of the residuals from the model, so the 90% margin of error was 0.102 for each player.
Another step I took was to calculate the probability of each player either winning an MVP award or winning a Super Bowl as the starting quarterback. I did this with a logit model where the independent variable was career quarterback EPA/Play, then I substituted the values for the 2020 drafted quarterbacks. The results are shown below.
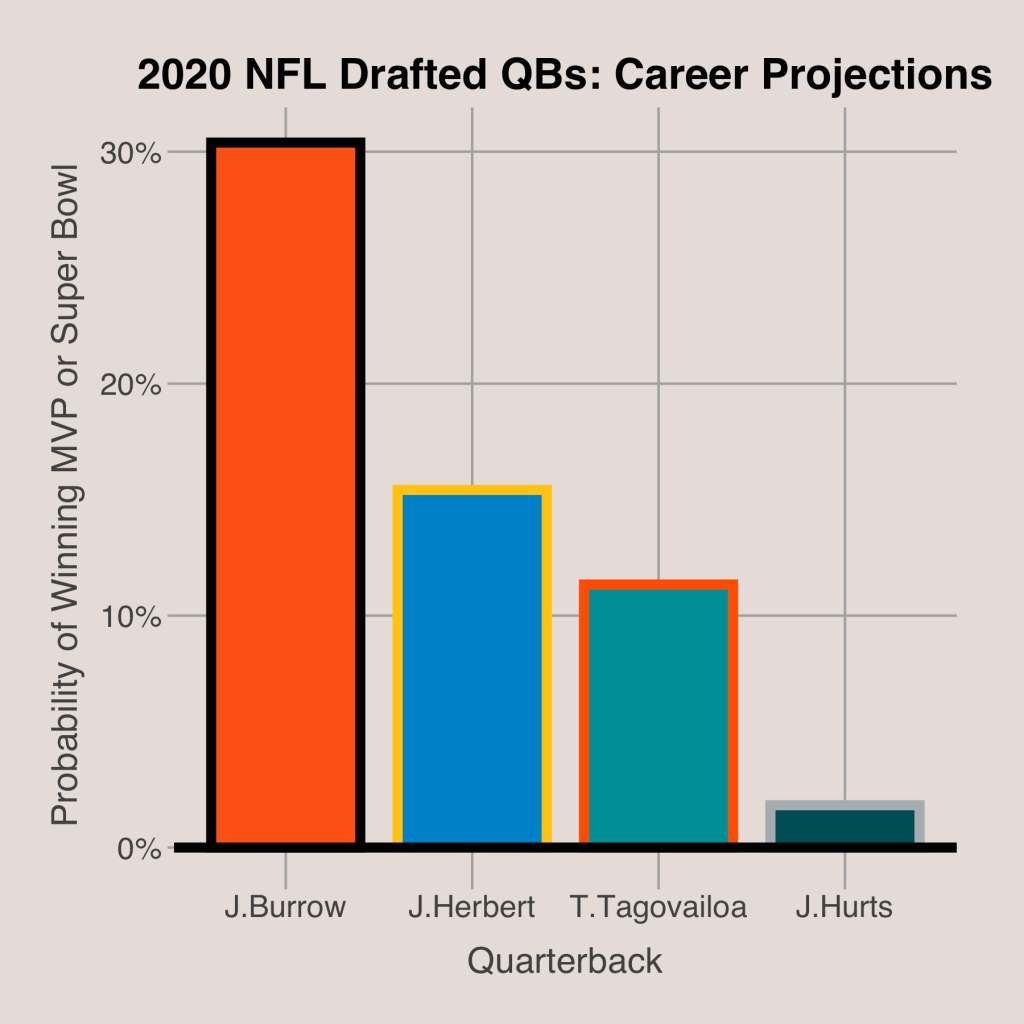
Both of these graphs show that Joe Burrow has the best potential of the quarterbacks drafted last year. He was both aggressive and accurate, while showing some mobility. Additionally, being the number 1 pick last year also helped his prediction since many 1st overall picks (like Goff, Stafford, and Luck) have gotten better after their rookie seasons. Meanwhile, Herbert and Tagovailoa still show lots of promise, even if Tagovailoa’s rookie season may not have gone well. Tagovailoa had a good completion percentage, and he interestingly averaged more air yards per target than Herbert. Lastly, Jalen Hurts is likely to be a bust. He had an atrocious completion percentage in his rookie year, tanking his prediction even though he had a high aDOT and rush percentage. You can count on Joe Burrow to be the best quarterback from the 2020 draft. Some additional info on the predictions is added below.
Joe Burrow, Cincinnati Bengals
Stats
- Completion%: 65.3%
- aDOT: 8.50 yds
- Draft Pick: 1st
- Rush%: 8.4%
Predictions:
- Career EPA/Play: 0.113
- Similar to: Kurt Warner, Ben Roethlisberger, Matt Ryan
- 85th Percentile
Ceiling:
- Career EPA/Play: 0.215
- Similar to: Aaron Rodgers, Tom Brady, Peyton Manning
Floor:
- Career EPA/Play: 0.011
- Similar to: Joe Flacco, Jay Cutler, Mitchell Trubisky
Justin Herbert, Los Angeles Chargers
Stats
- Completion%: 66.6%
- aDOT: 7.35 yds
- Draft Pick: 6th
- Rush%: 8.5%
Predictions:
- Career EPA/Play: 0.072
- Similar to: Baker Mayfield, Cam Newton, Andrew Luck
- 75th Percentile
Ceiling:
- Career EPA/Play: 0.173
- Similar to: Drew Brees, Lamar Jackson, Deshaun Watson
Floor:
- Career EPA/Play: -0.030
- Similar to: Blake Bortles, Case Keenum, Jacoby Brissett
Tua Tagovailoa, Miami Dolphins
Stats
- Completion%: 64.1%
- aDOT: 7.50 yds
- Draft Pick: 5th
- Rush%: 11.0%
Predictions:
- Career EPA/Play: 0.055
- Similar to: Jared Goff, Tyrod Taylor
- 69th Percentile
Ceiling:
- Career EPA/Play: 0.157
- Similar to: Philip Rivers, Tony Romo, Deshaun Watson
Floor:
- Career EPA/Play: -0.047
- Similar to: Brian Hoyer, Chad Henne, Colt McCoy
Jalen Hurts, Philadelphia Eagles
Stats
- Completion%: 52.0%
- aDOT: 9.14 yds
- Draft Pick: 53rd
- Rush%: 25.6%
Predictions:
- Career EPA/Play: -0.037
- Similar to: Jacoby Brissett, Trevor Siemian, Brandon Weeden
- 37th Percentile
Ceiling:
- Career EPA/Play: 0.065
- Similar to: Matthew Stafford, Carson Palmer, Jared Goff
Floor:
- Career EPA/Play: -0.139
- Similar to: Mark Sanchez, Kevin Kolb, Blaine Gabbert
