
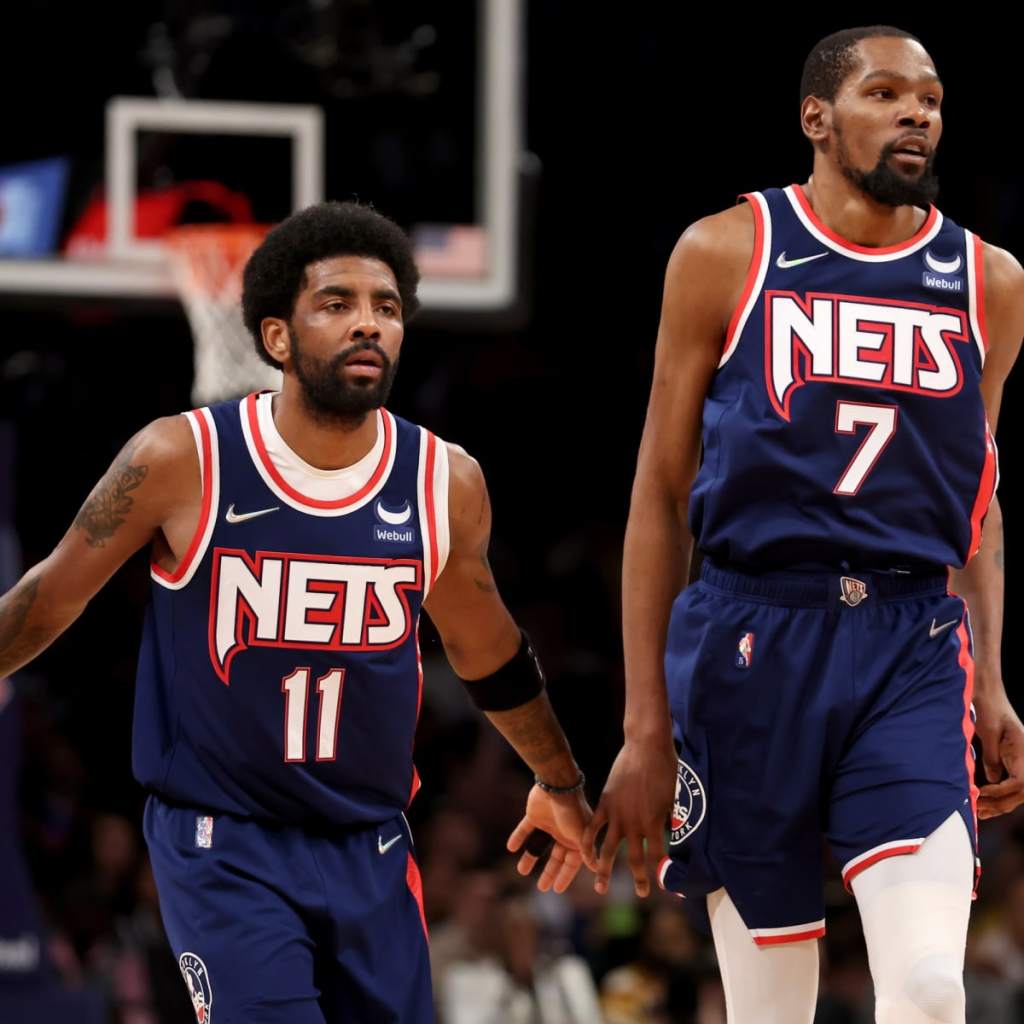
One of the most unfortunate things in sports are injuries. Teams and players have almost no control over this, and one wrong move can derail a team’s season or a player’s career. Take the Brooklyn Nets, for example. The Nets looked like they would be one of the NBA’s top contenders, but an injury to Kevin Durant in addition to absences from Kyrie Irving due to vaccination policies led to a season in which the Nets exited the playoffs in the first round. Now, they look at an uncertain future as Durant has requested a trade.
Using advanced stats to estimate player impact, we can determine approximately how many wins were lost due to injuries and player absences during a season. We can find out how good the Nets would have been if Durant and Irving played the whole season. We can see which teams have had the best and worst injury luck and which players have costed their teams the most through injuries.
Sample
The sample in the calculations for the rest of the article included players that played at least 10 games and at least 100 total minutes in seasons between 2017-18 and 2021-22. Because players had to have at least 10 games played in one season, I could not estimate the impact of players that were absent for an entire season. This includes players like Kawhi Leonard, Jamal Murray, and Zion Williamson for the most recent season. The same is true for any high caliber players that played fewer than 10 games in any season from 2017-2022.
Additionally, players that were traded in-season were not included because it is difficult to incorporate data on when exactly the trade occurred in the season.
Approximating Player Per-Minute Value
To approximate player value, I used 3 different advanced statistics. They were PER (player efficiency rating), BPM (box plus-minus), and Win Shares per 48 minutes. All three vary in how they are calculated, but all of them use box score statistics and are easy to find on Basketball Reference. The idea behind using 3 different advanced metrics as opposed to just one is that using all 3 will help to balance each individual metric’s biases and flaws.
There are some issues with just using the raw values of these stats, though. First, they are biased towards some positions over others. Second, they are on different scales. These issues were easy solved by using z-scores (transforming variables so they are all on the same scale with a mean of 0 and a standard deviation of 1).
Let’s look at the first issue: positional bias. All 3 of the stats are biased towards different positions in some way. For example, win shares value centers over every other position by a significant amount, while shooting guards and small forwards tend to have lower values.
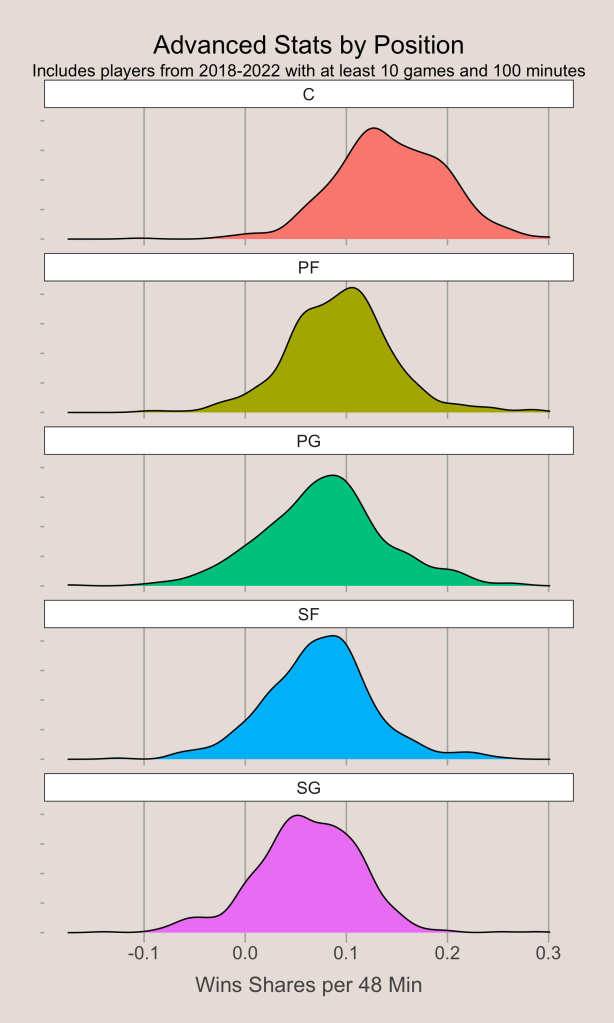
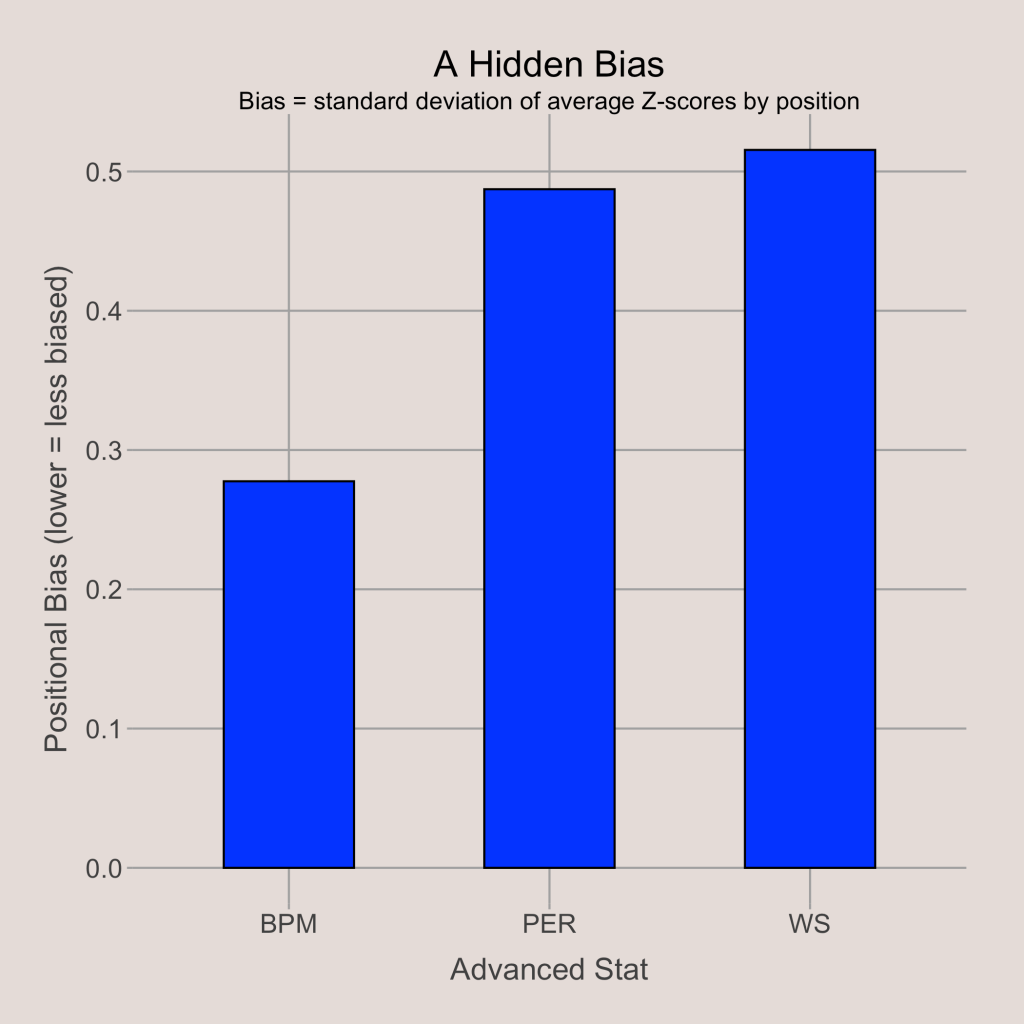
This issue is not limited to only win shares. While win shares per 48 minutes has the greatest positional bias of the 3 advanced metrics I used, PER and BPM still favor centers over other positions. In the graph below, I measured the positional bias by first putting all 3 metrics on a standardized scale, then finding the average z-score by position for each metric, and finally taking the standard deviation of the average positional z-scores.
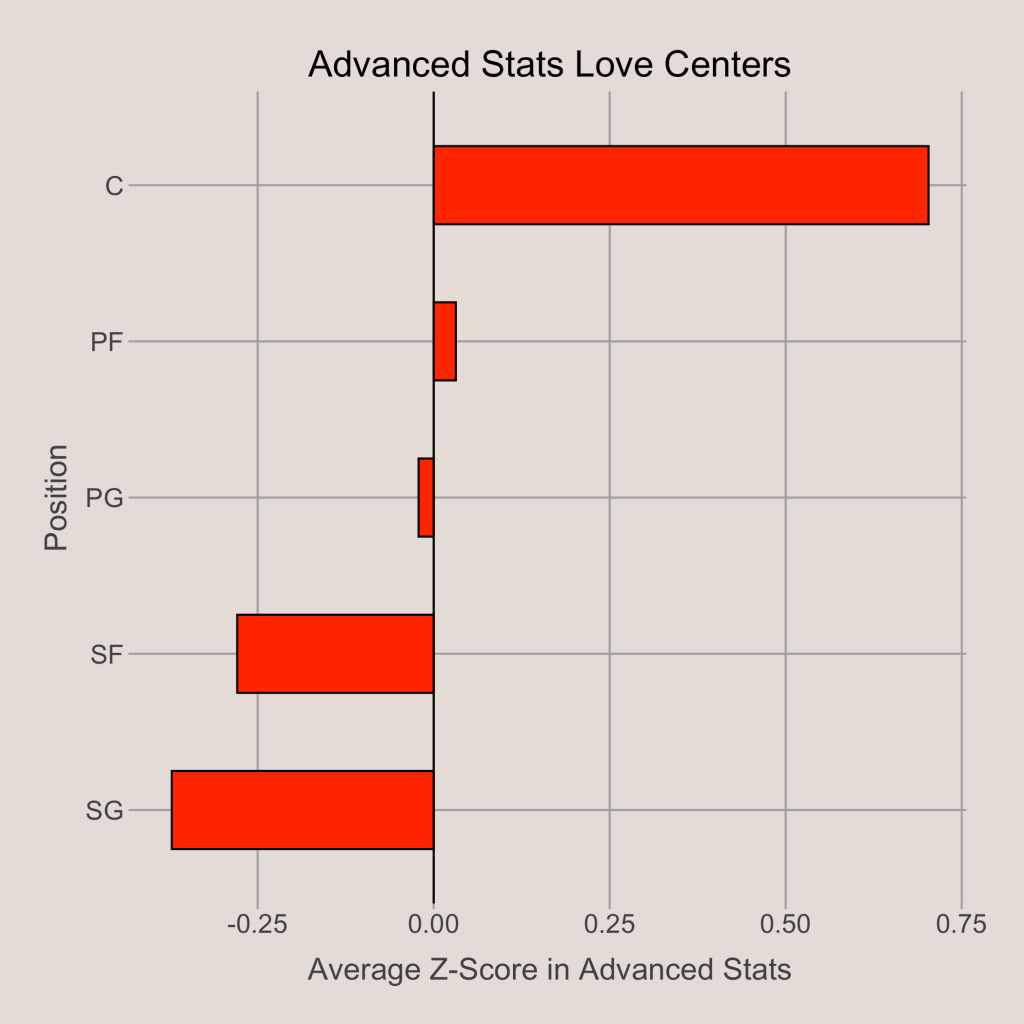
To account for this obvious positional bias, I grouped all the players of the same positions together. Now, there were 5 groups of players divided by position instead of one big group of all the players. After grouping, I standardized the PER, BPM, and WS/48 of each player, then grouped them all back together again in one group. After this, all positions had the same average z-score of 0 in each statistic. If I had not done this, centers would be greatly overvalued in the following calculations. As seen in the graph below, the average z-score for centers without accounting for position is much, much greater than any other position.
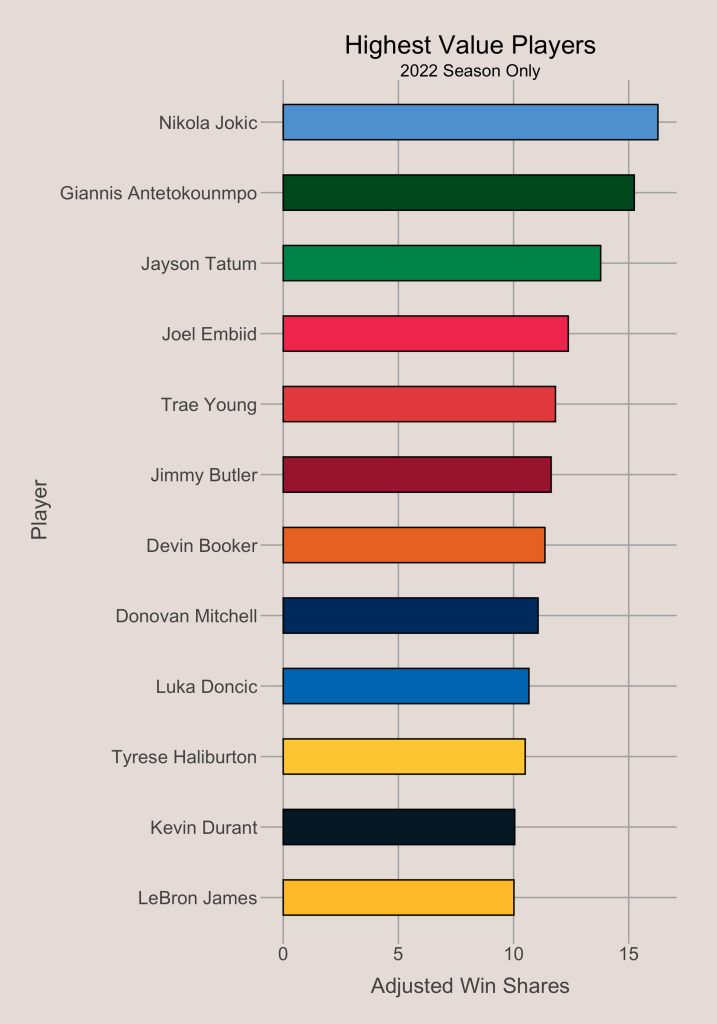
Now that all the stats are on the same scale with a mean of 0 and standard deviation of 1 with position accounted for, I averaged them to create one number that represents how much a player helps his team. I will call this number the Average Score. According to the Average Score, the players with the greatest per-minute impact in the 2021-22 NBA season were (in order) Giannis Antetokounmpo, Nikola Jokic, Jimmy Butler, Joel Embiid, and Jayson Tatum.
Approximating Total Player Value
Now that we have one number that represents player ability, we can transform it to find the Adjusted Win Rate (AWR). The AWR of a player simply represents approximately how many wins he adds over 48 minutes. Win shares per 48 minutes was the only original statistic that was on a scale of wins, so I found the original mean and standard deviation of the WS/48 of the players in the sample. The mean was 0.0889 wins/48 and the standard deviation was 0.0615 wins/48. To convert from Average Score to Adjusted Win Rate, I multiplied the Standardized Player Ability by the standard deviation of wins/48 and then added the mean of wins/48. For example, a player with an Average Score of 1.000 would have an Adjusted Win Rate of about 0.1504, meaning he adds about 0.1504 wins for every 48 minutes he plays. Doing this calculation allows us to convert from a standardized scale to a scale of wins.
After calculating the Adjusted Win Rates of the players, simple arithmetic will lead us to how many wins each player adds to the team. If the Adjusted Win Rate is multiplied by total minutes then divided by 48, we arrive at the Adjusted Win Shares. The players with the most Adjusted Win Shares in the 2021-2022 NBA season are shown below.
Replacement Players
To get an idea of how much a player adds to a team, we have to compare players to the benchmark of a replacement player. A replacement player is usually a below average player that can be easily acquired through free agency or a low cost trade. Often, when an important player gets injured for a team, the team needs to add one or more replacement players to fill out the roster during the absence.
I defined a replacement player for this exercise as the average Adjusted Win Rate for a player that is below the median. Using this, the Adjusted Win Rate (shown as Position Adjusted WS/48 in the graph below) of a replacement player equals 0.048 wins per 48 minutes.
Examples of replacement level players in 2022 using this criteria include De’Andre Hunter, Blake Griffin, and Khem Birch.

Expected Games Played
Not all players play the same amount of time. This is obvious, as better players play significantly more than others. This is true for both minutes per game and total games played in the season. To approximate wins lost due to injury, we need to have an expectation for the number of games a player should play. To predict this, I used minutes per game, since minutes per game is not affected by injury nearly as much as total games played.
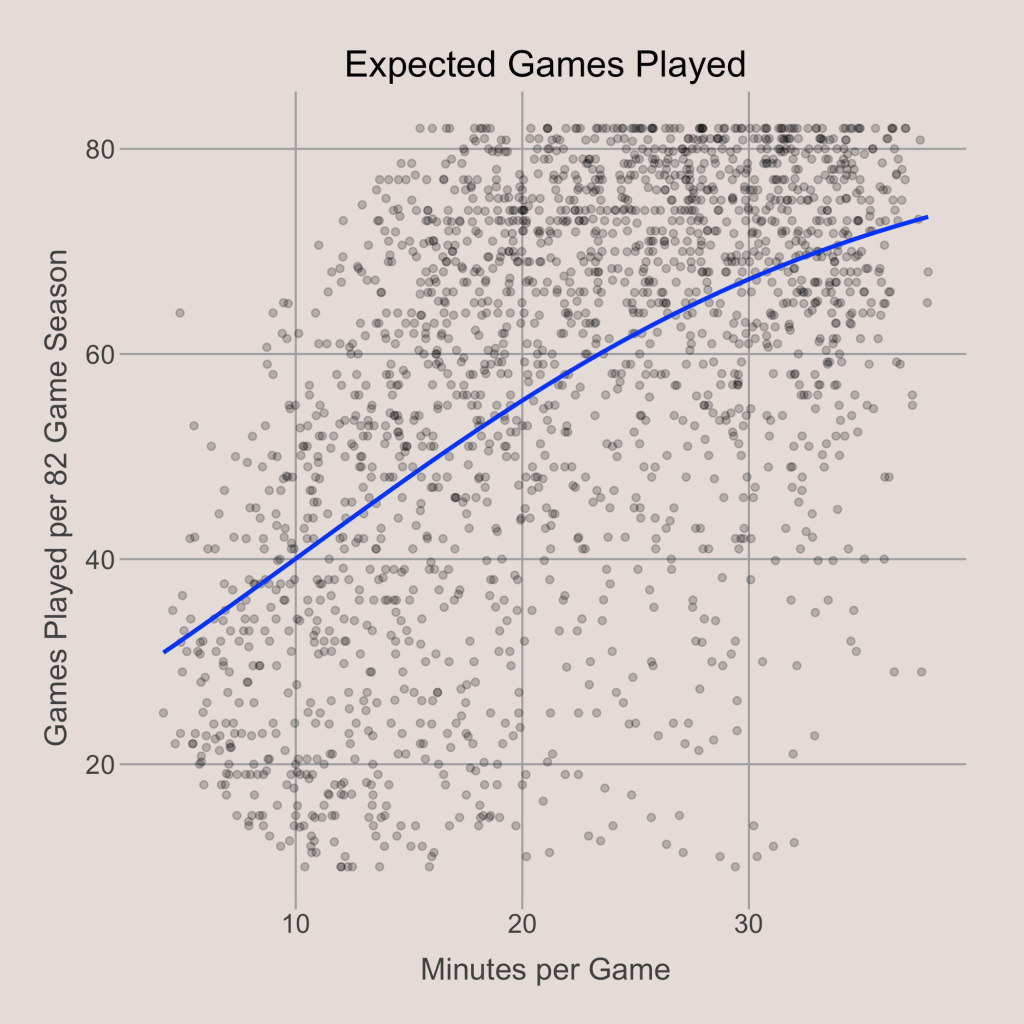
After running a regression to find the expected number of games played based on minutes per game, I adjusted this number to how many games are in a season. Because the sample includes regular season data from the 2017-18 season to the 2021-22 season, there were different numbers of total games played per team in different seasons. Because of COVID, teams in the 2019-20 season played between 64 and 75 regular season games while the 2020-21 regular season was shortened from 82 games to 72 games per team.
Injury Cost
Now, we have all the components necessary to estimate the number of wins lost due to injury for a player or a team. Using Adjusted Win Rate and the Replacement Player Adjusted Win Rate (0.048), we can subtract to get the Adjusted Win Rate over Replacement. This number is divided by 48 then multiplied by minutes per game to estimate the number of wins per game a player adds over a replacement-level player. Finally, we find the games played under expected by subtracting actual games played from expected games played, and multiply this value with the Adjusted Win Rate over Replacement per game. This number gives us the injury cost of a player in wins.
Here is an example. In the 2019-20 season, Kyrie Irving had an Adjusted Win Rate of 0.2344. His Adjusted Win Rate over Replacement equals 0.2344 minus 0.0480, which is 0.1864. Irving played 32.9 minutes per game, so his Adjusted Win Rate over Replacement per game is 32.9 divided by 48, times 0.1864. This equals 0.1278 wins/game. Based on his minutes per game, Irving was expected to play 61.3 of the Nets’ 72 games that season. In reality, Irving played in just 20 games. Therefore, he had 41.3 games played under expected. Multiplying 41.3 games by 0.1278 wins/game gives us 5.278 wins, which was Kyrie Irving’s injury cost in the 2019-20 NBA season. Based on his stats, we would expect the Nets to win about 5.3 more games if Irving played as much as expected.
This process was repeated for all players in the sample.
Team Stats
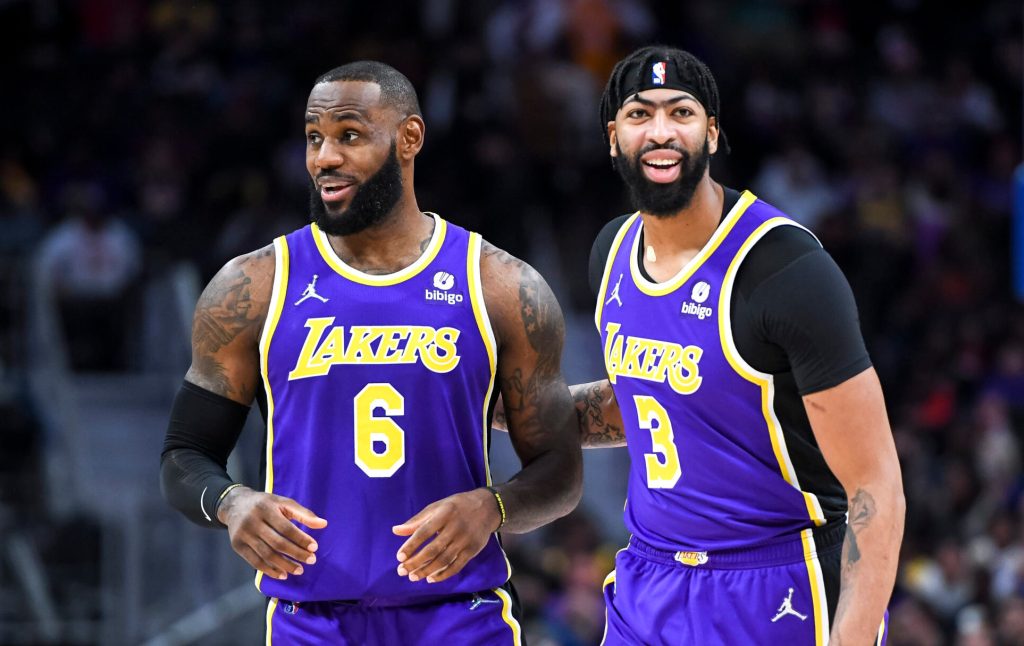
After applying the calculations to all the players in the sample, I added up the values for players on the same team to get the approximated wins lost to injury for each team. In the previous season, the Nets lost the most production due to injury, as Irving played just 20 games and Kevin Durant played 55 games. Kyrie Irving cost the team an estimated 4.3 wins due to his absences (which were mostly due to COVID) while Durant cost the Nets about 2.6 wins. If they both played as many games as expected, the Nets’ win-loss record would be about 51-31, which was the same as the Celtics, Bucks, and 76ers.
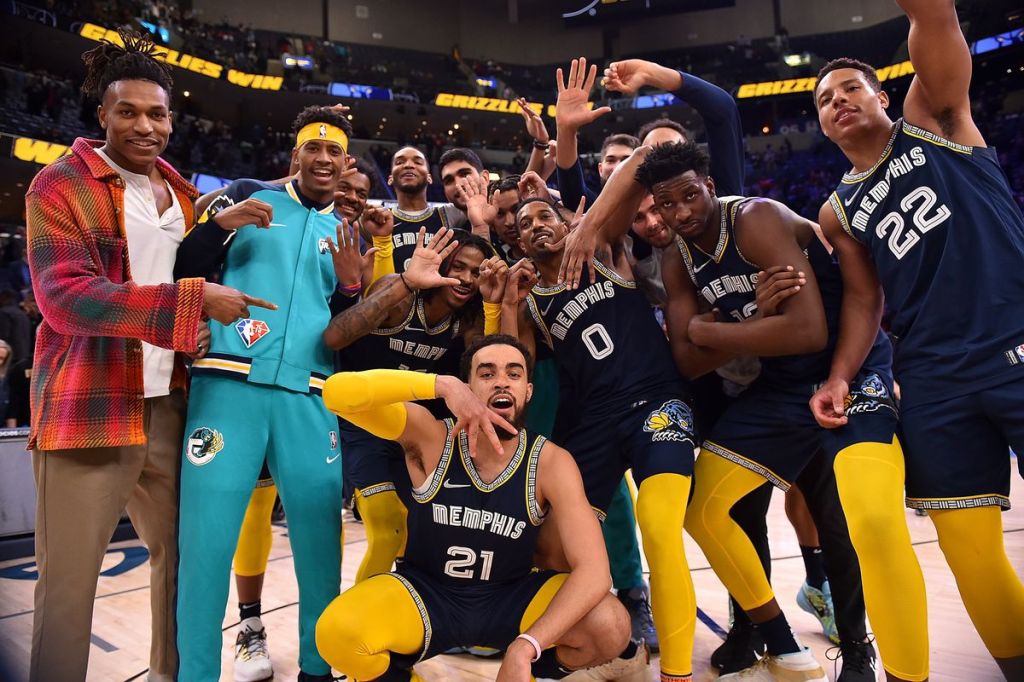
The Grizzlies, meanwhile, lost the least production due to injury. In fact, they gained about 2.5 wins to due a lack of injuries. While it is true that Morant’s injury hurt the team (about 1.5 wins), almost all of their other important players played many more games than they were expected to. This includes Desmond Bane, Tyus Jones, De’Anthony Melton, Brandon Clarke, and Jaren Jackson Jr.
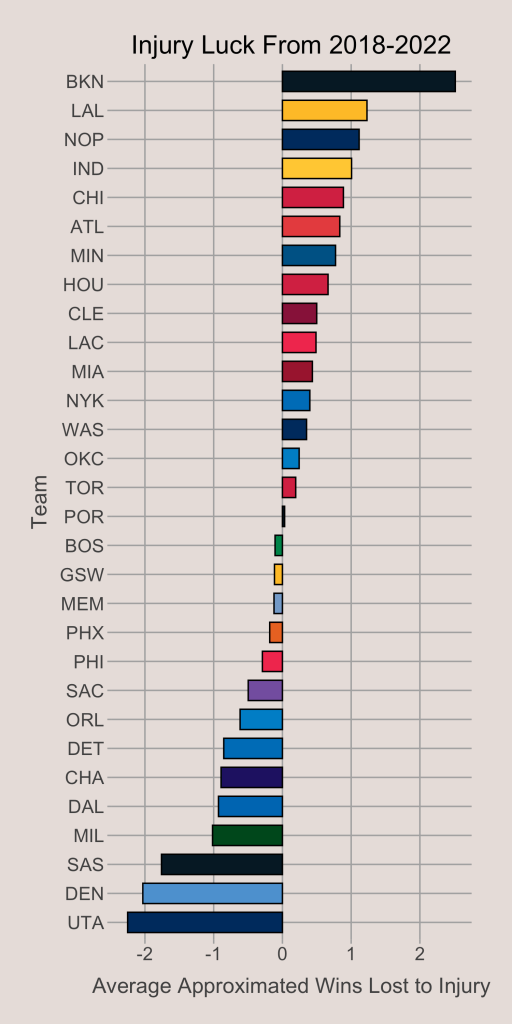
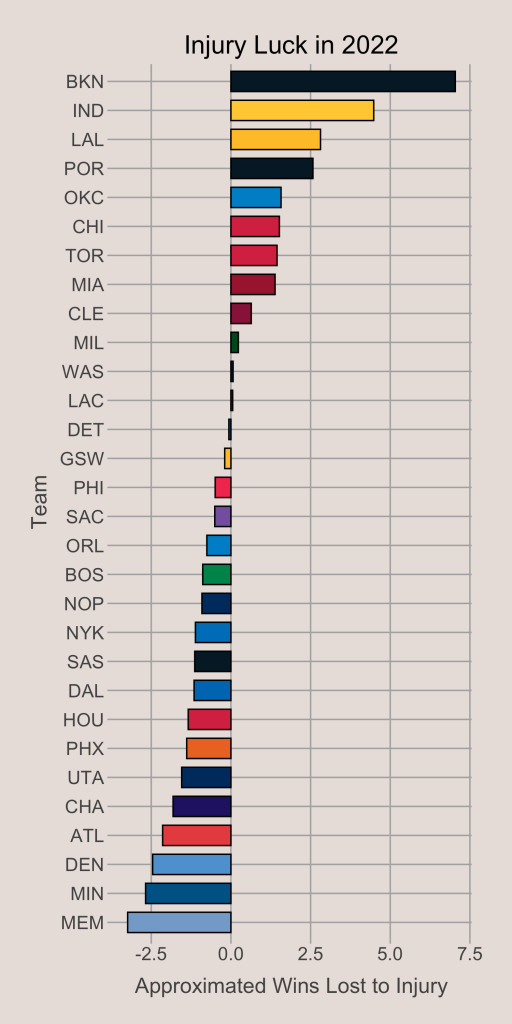
The average wins lost to injury for all 30 NBA teams during the 5 year sample is shown above. The Nets have had the least fortune with injuries, as absences from Irving and Durant in the past few seasons have limited them from reaching their true potential. The Lakers have also lost seasons due to injury as LeBron James and Anthony Davis have both had extended absences in the past few years. The Pelicans have gotten poor luck with Anthony Davis missing much of the 2019 season, Zion Williamson missing most of his rookie year (and all of the last season), and Brandon Ingram playing just 55 games (expected to play 70.7 games) in 2021-22.
The most lucky teams have been the Jazz and Nuggets. For the Jazz, neither Donovan Mitchell nor Rudy Gobert had any significant injuries during their time together. In the Nuggets’ case, Nikola Jokic’s availability has helped significantly as he played in 299 of a possible 309 games (97%) from 2019 to 2022.
Player Stats
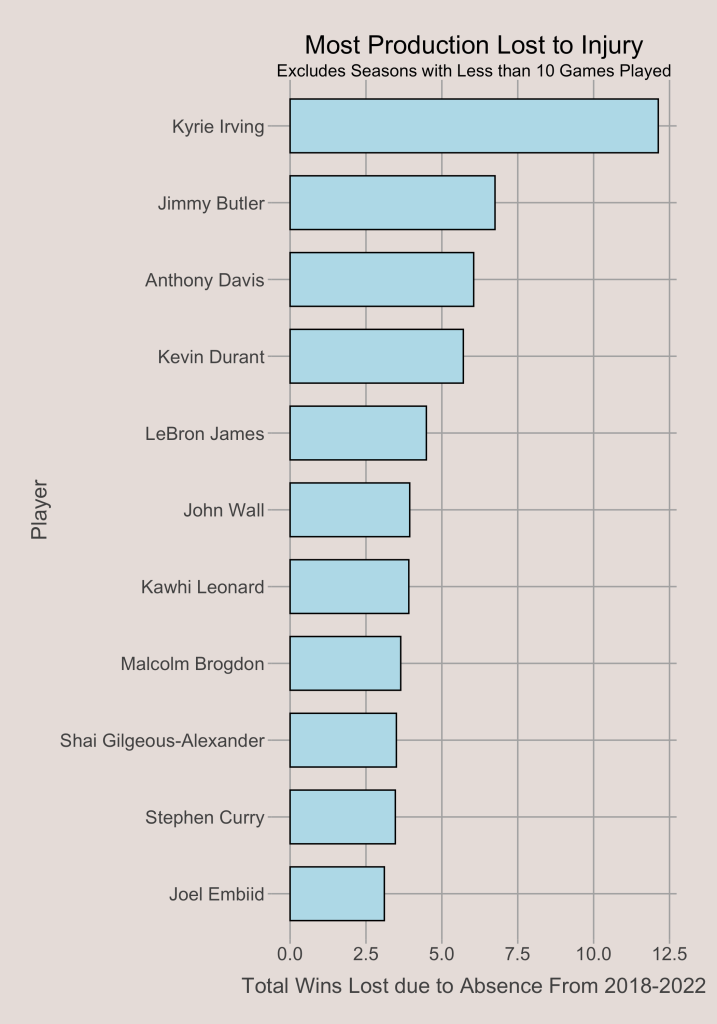
Finally, by adding up values from 2018 to 2022, I found the total cost of injuries in wins for each player. Kyrie Irving has lost his teams over 12 total wins due to absences from injuries and COVID, which is almost double the next highest player. Still, injuries to stars like Butler, Davis, Durant, and LeBron are preventing their teams from getting better seeds in the playoffs and an easier path to the finals.

Consistency
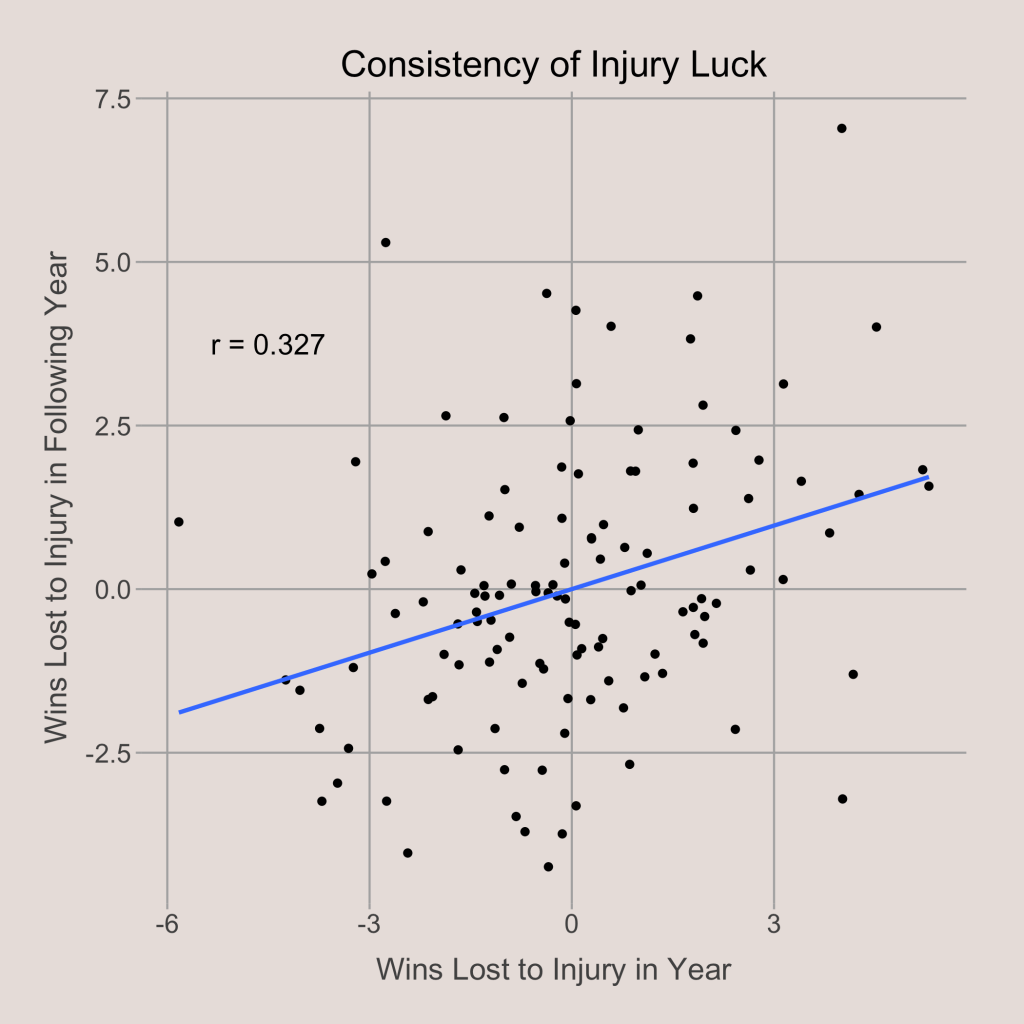
The final aspect of injuries that I wanted to explore was the consistency of injuries from year to year. Using total injury wins by team, I found the correlation of injury wins from one season to the next. The correlation comes to be 0.327, meaning there is a very moderate positive association in injury wins from one season to the next. This was surprising to me since I expected the correlation to be a lot smaller. This means that there is some degree of predictability in injuries. We can expect the Nets to have some injury problems next season (although not as much) because Kyrie Irving and Kevin Durant are still on the team (for now), and both of them have extensive history or injuries or absences.
