

Outside shooting is more important now than ever in the NBA. The frequency of three point attempts has been increasing since the beginning of the 2010’s. The simplest measure of 3-point ability is basic 3-point percentage, but this metric does not tell the whole story. It lacks too much context. A player can make 30 of 100 3-pointers that are all heavily contested pull-up shots while another can make 30 of 100 wide open shots and they will both still have the same 3-point percentage of 30%, even though it is obvious that the former player is a far superior shooter. By accounting for shooting circumstances like if a dribble was taken before the shot, how close the defender is, how much time is remaining on the shot clock, and the shot location, I created a new statistic to measure NBA players’ true shooting abilities.
Variables
Catch & Shoot vs Pull-Up
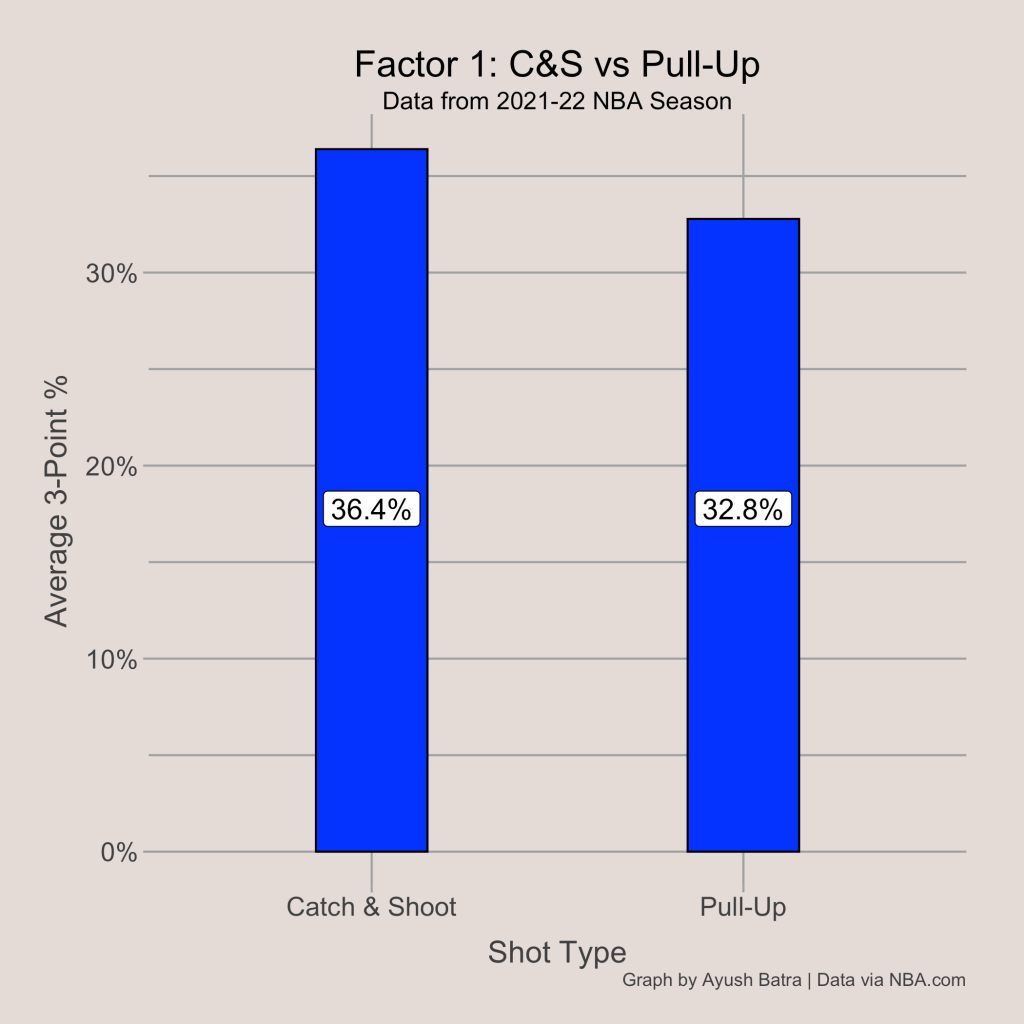
When a player takes a 3-point attempt where he does not dribble before shooting the ball, the shot is classified as a “catch and shoot” 3-point attempt. These types of shots are much easier than shooting off the dribble because shooting off the catch allows a player to get his shooting motion started faster, not having to transition from dribbling to shooting. Because of this, the shot occurs quicker and prevents defenders from being able to contest the shot as effectively.
Using data from the previous NBA season (2021-22), the league average catch and shoot 3-point percentage is 36.4%. Meanwhile, pull-up 3-point attempts are converted about 32.8% of the time. Obviously, these quality of the shot is impacted by the shooter: Steph Curry shooting a pull-up 3 is more efficient than Giannis Antetokounmpo shooting a catch and shoot attempt.
Players that takes lots of three point attempts off the dribble should have lower expected percentages since they’re taking more difficult shots. Their expected 3-point percentage can be easily calculated: multiply the proportion of 3-point attempts that are pull-ups by the average NBA pull-up 3P%, and then add it to the product of the catch & shoot proportion of 3-point attempts and the average NBA catch & shoot 3P%. The players that took the highest proportion of pull-up 3-point attempts last season are shown below.

As we can see above, expected 3-point percentage can change by a significant amount when we account for situation. Trae Young’s expected 3P% was 33.3%, which is over 2 percentage point lower than the NBA average 35.4%. This makes his 38% 3-point percentage even more impressive, as he could possibly be over 40% if he took easier attempts.
Closest Defender Distance
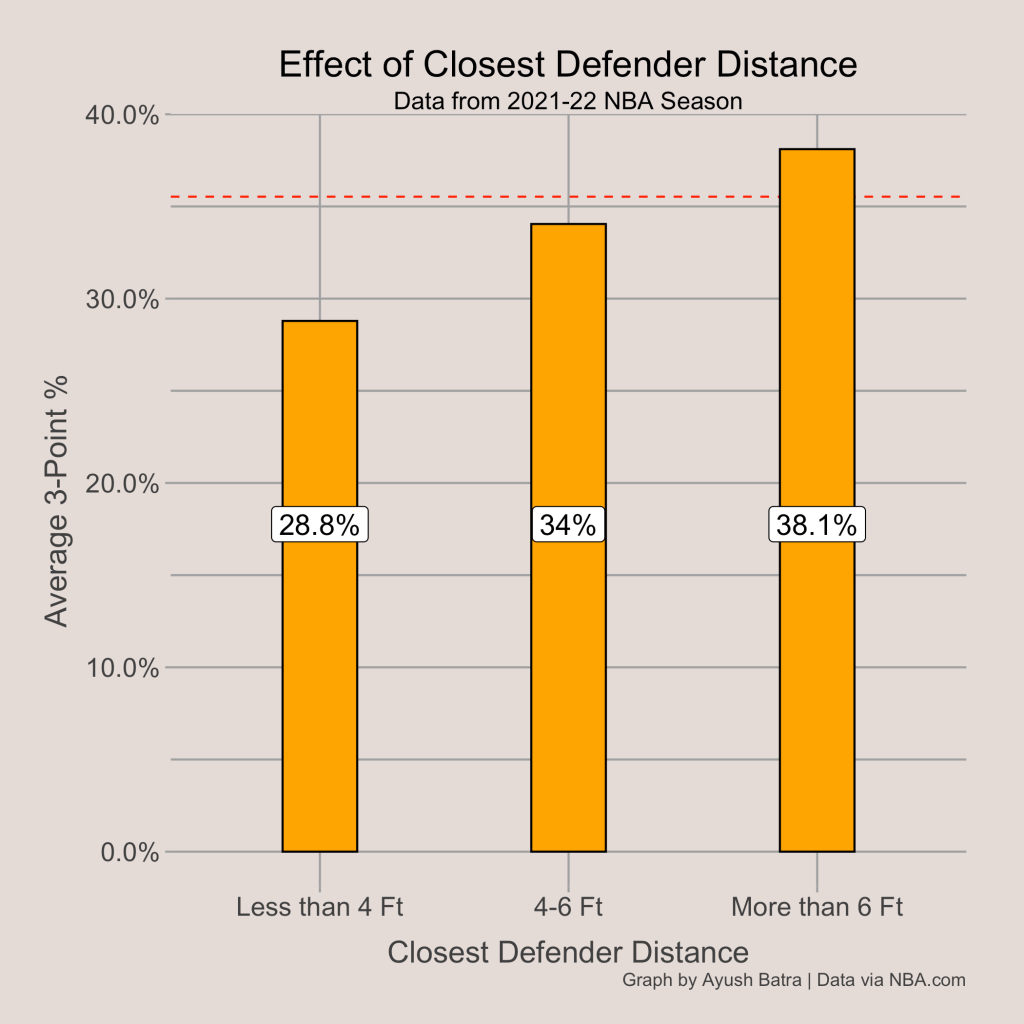
When thinking about the factors that influence a shooter’s probability of making a shot, the first thing that comes to mind is how open the shooter is. There is a massive difference between shooting a wide open shot versus shooting with someone covering. Using the data from the past season, we can see that the distance of the closest defender has a major impact on the chance of a shot going in. Wide open 3-point attempts are expected to be converted over 38% of the time, while a contested shot where the defender is 4 feet or fewer away has just a 29% chance of being made. Seeing these percentages, it is obvious why NBA teams try to create as many open perimeter shots as possible.
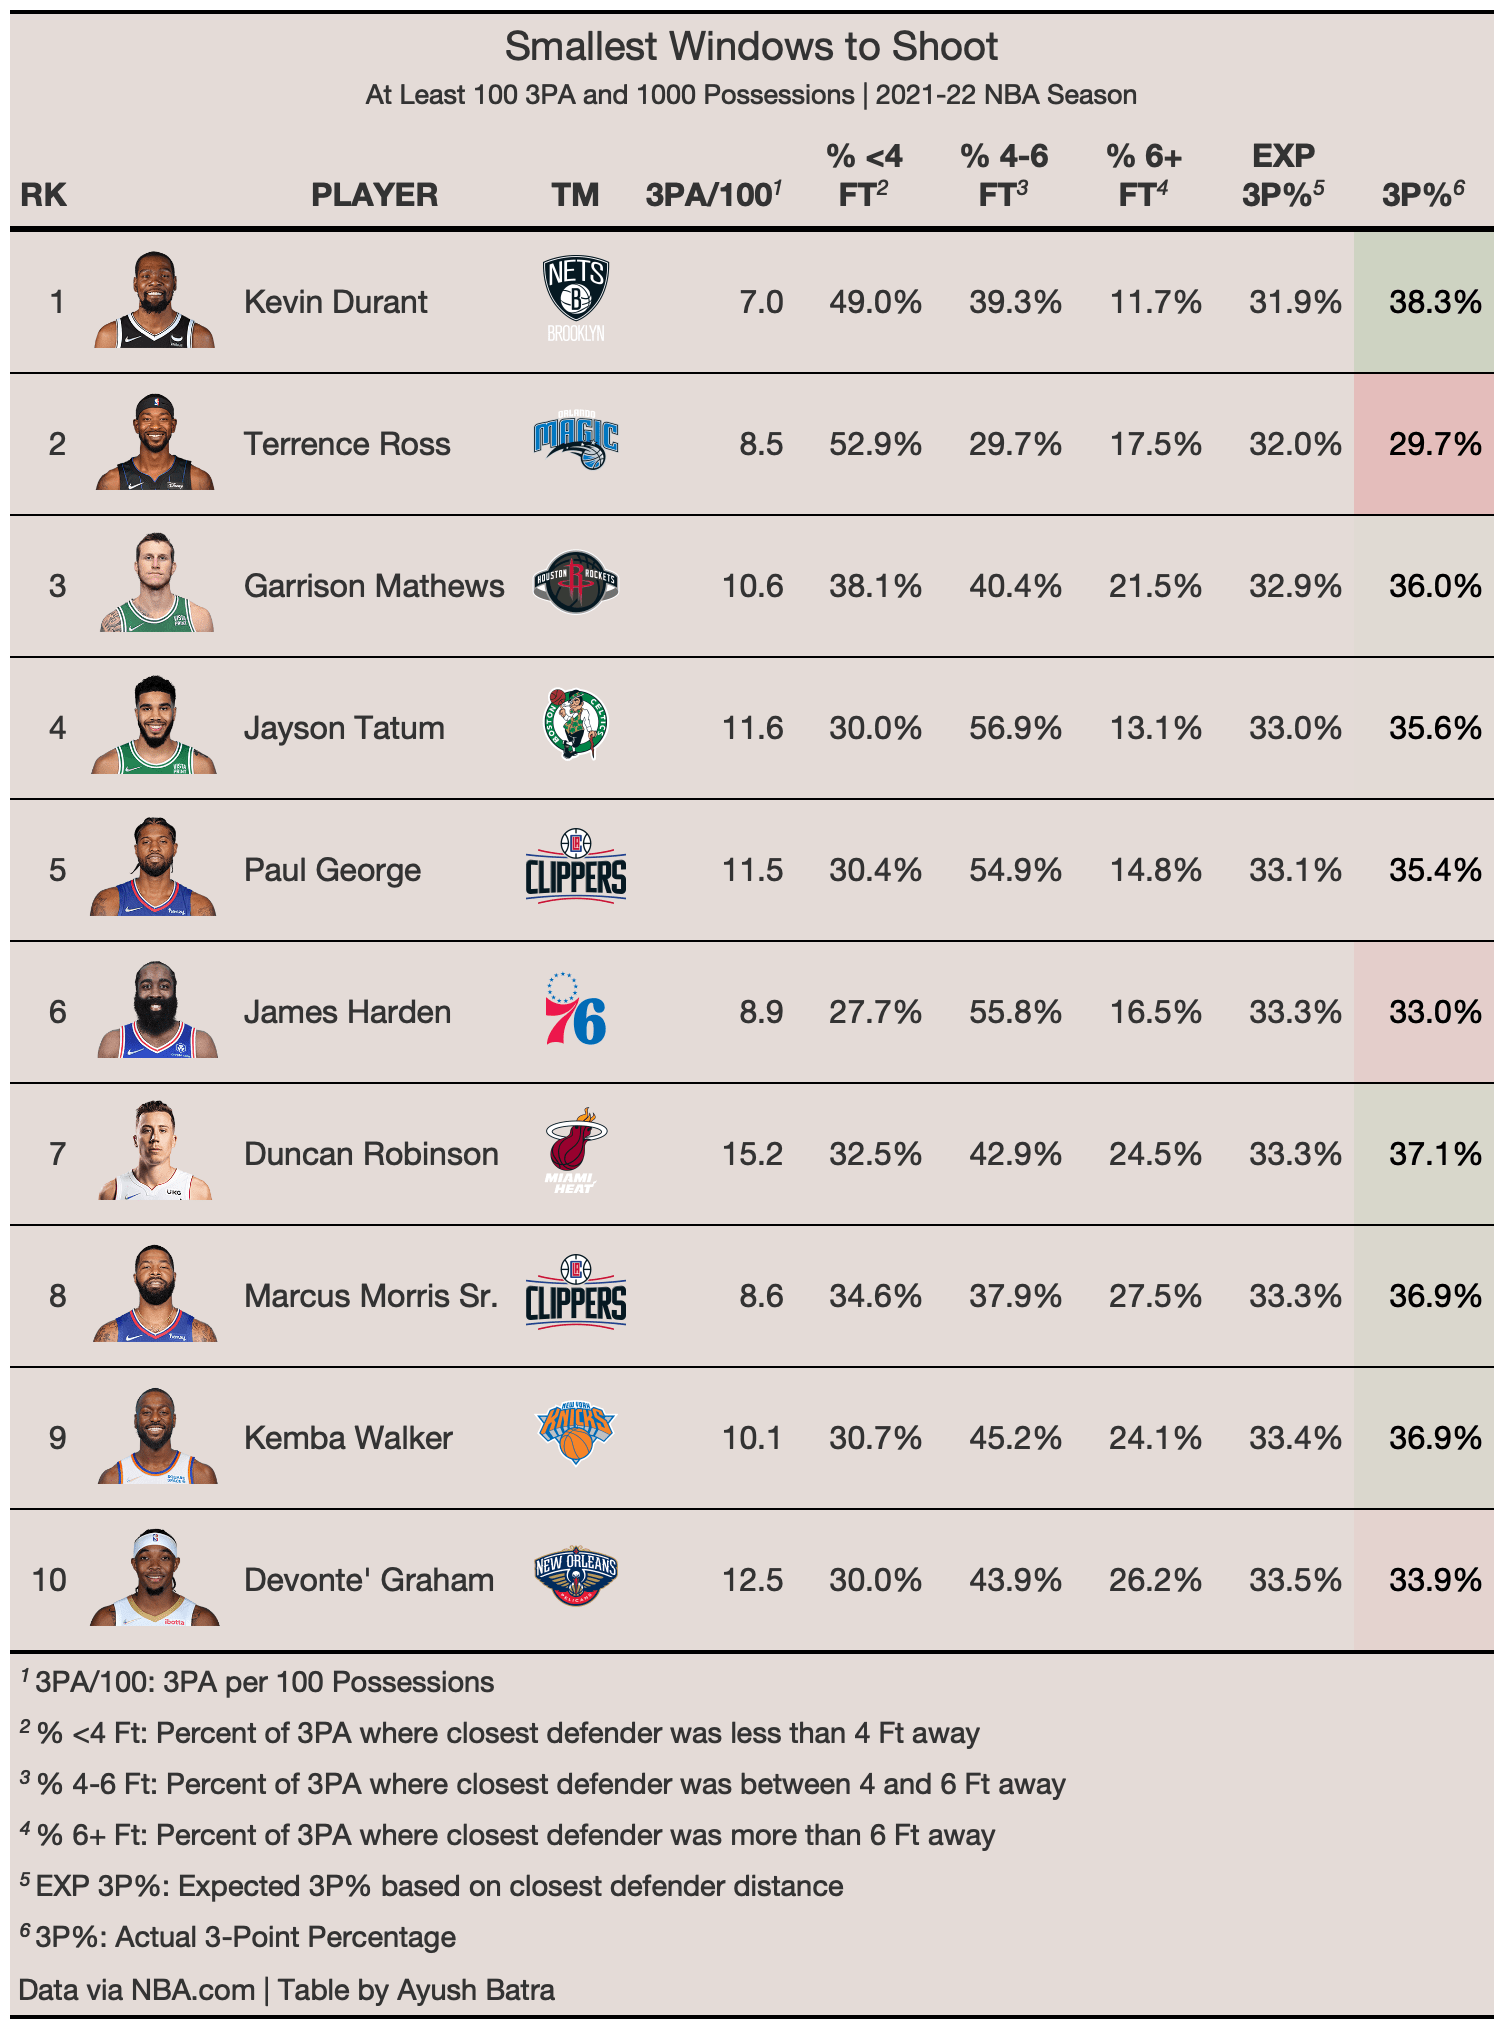
When thinking overall shooting ability, it is unfair to compare those who shoot many contested shots to others that are consistently converting wide-open 3-point attempts. Great shooters like Kevin Durant or Jayson Tatum may not have 3-point percentages in the 40’s because they are taking so many contested shots, bringing down their 3-point percentages. Below, we can see which players take the most contested shots, meaning they have low 3-point percentage expectations. The expected 3-point percentage was calculated in a similar way to the section above, as it is just the weighted average of the NBA-average 3-point percentage based on the proportion of 3-point attempts in each category.
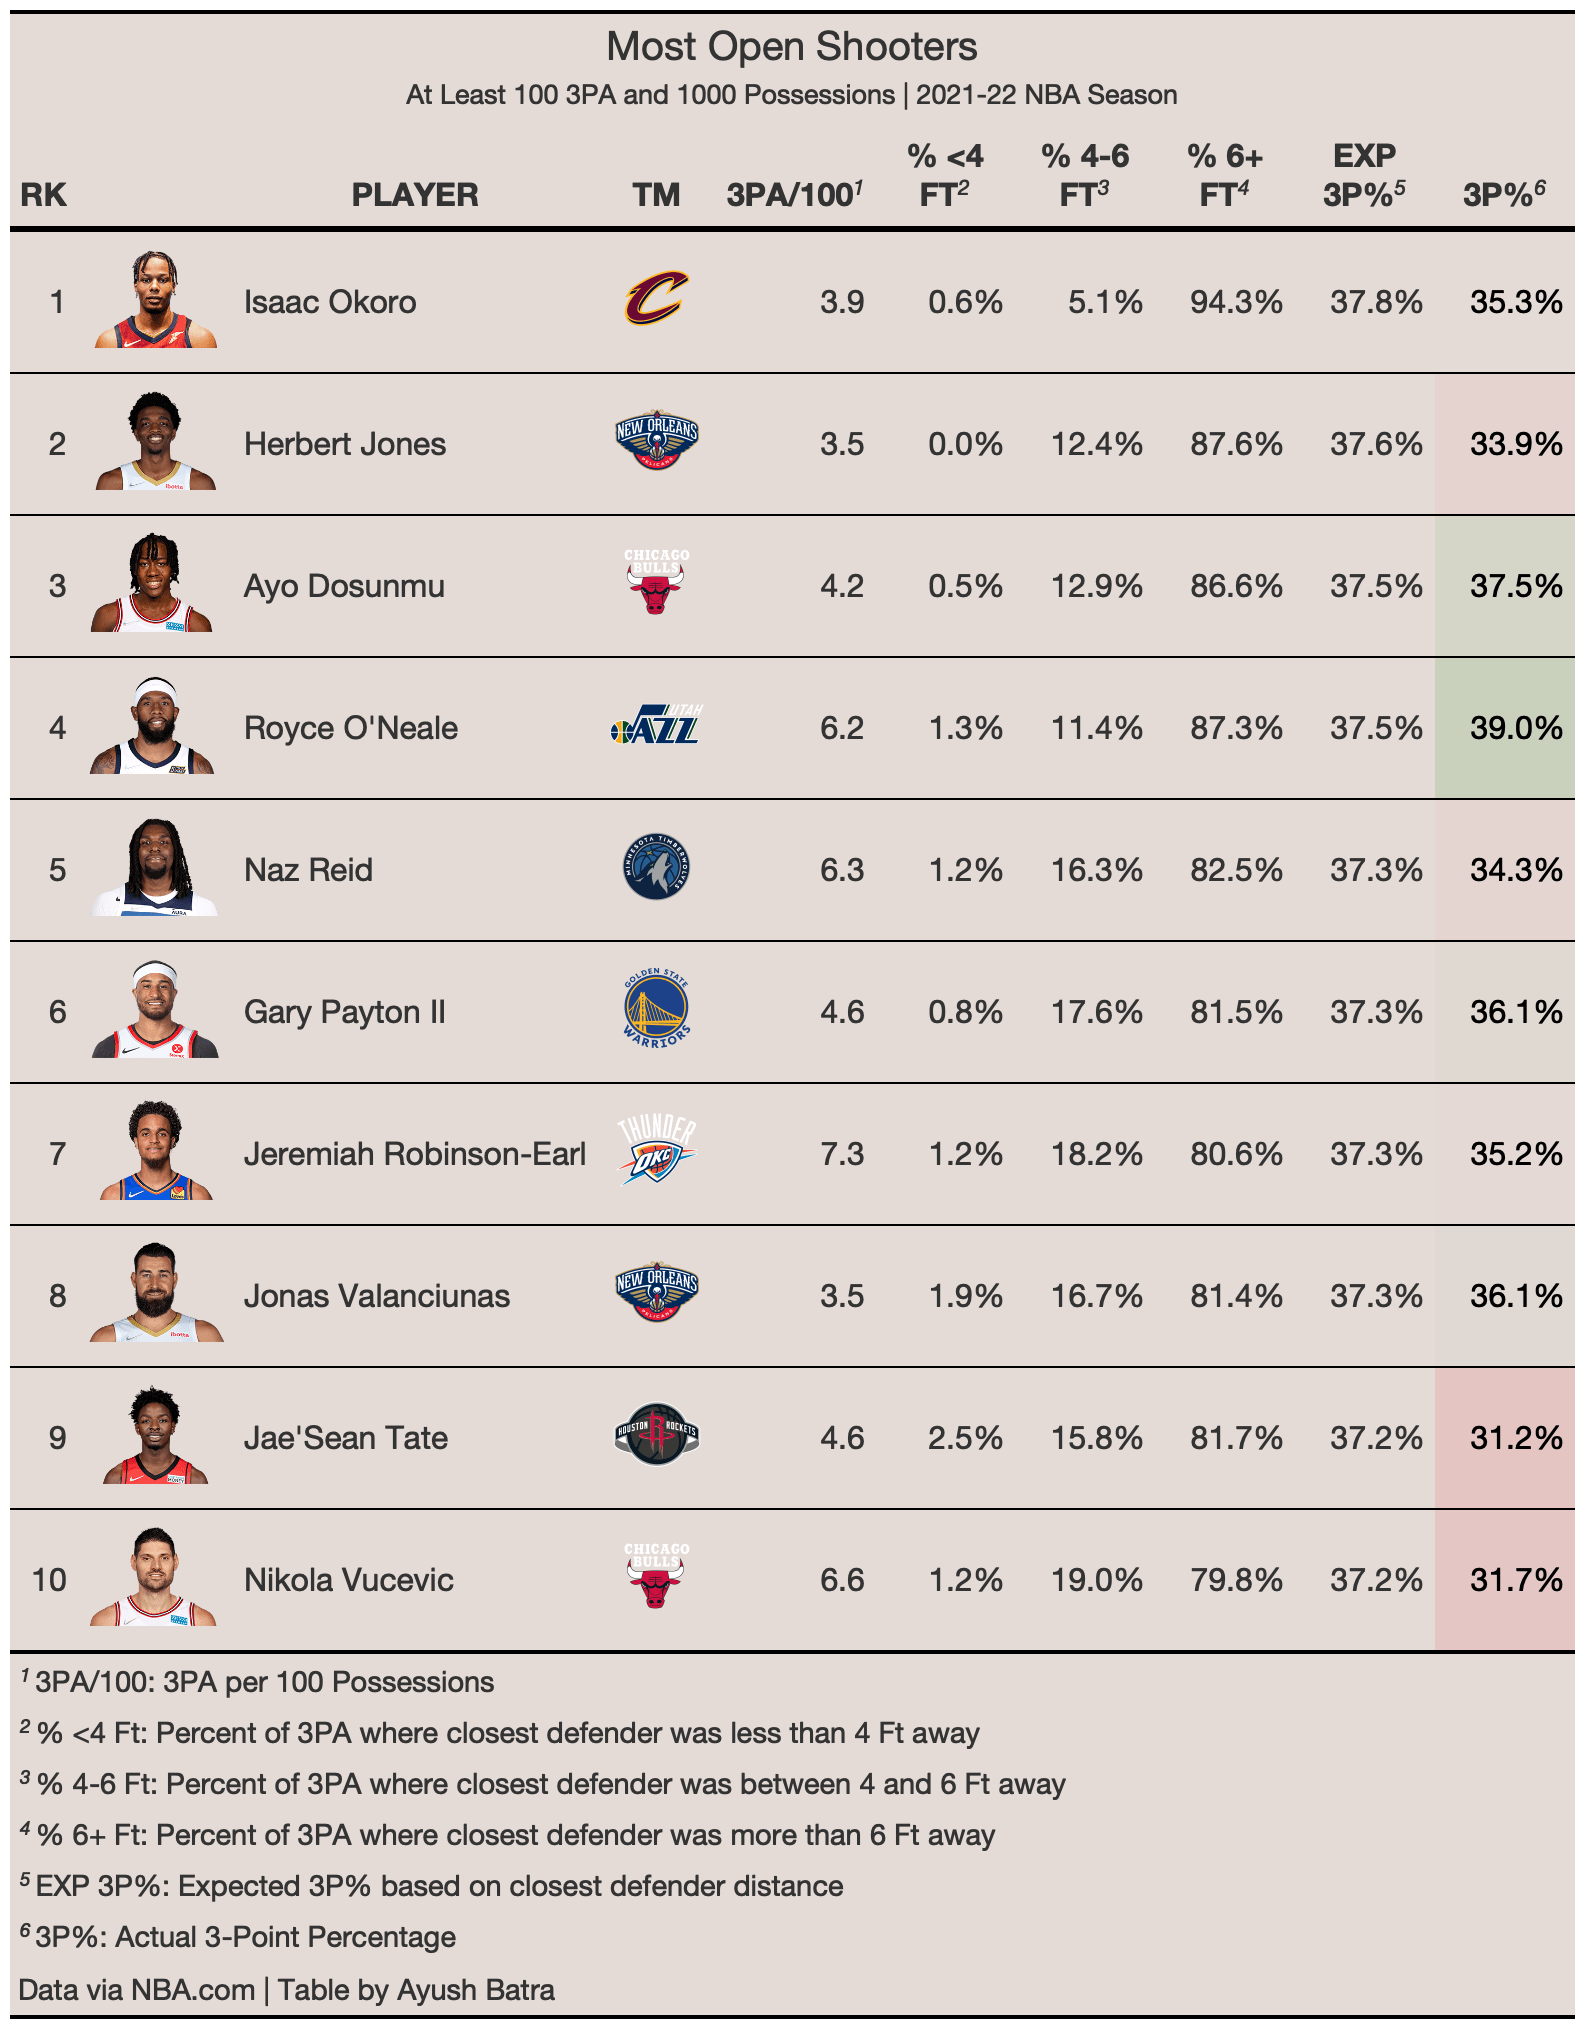
To contrast the most contested shooters to the most open shooters, those with the highest 3-point percentage expectation according to closest defender distance are shown below. We can quickly determine some poor shooters simply based off the fact they have less than average 3-point percentages even though they are taking mostly wide-open attempts. These players include Herb Jones, Naz Reid, Jae’Sean Tate, and Nikola Vucevic.
Shot Clock Remaining
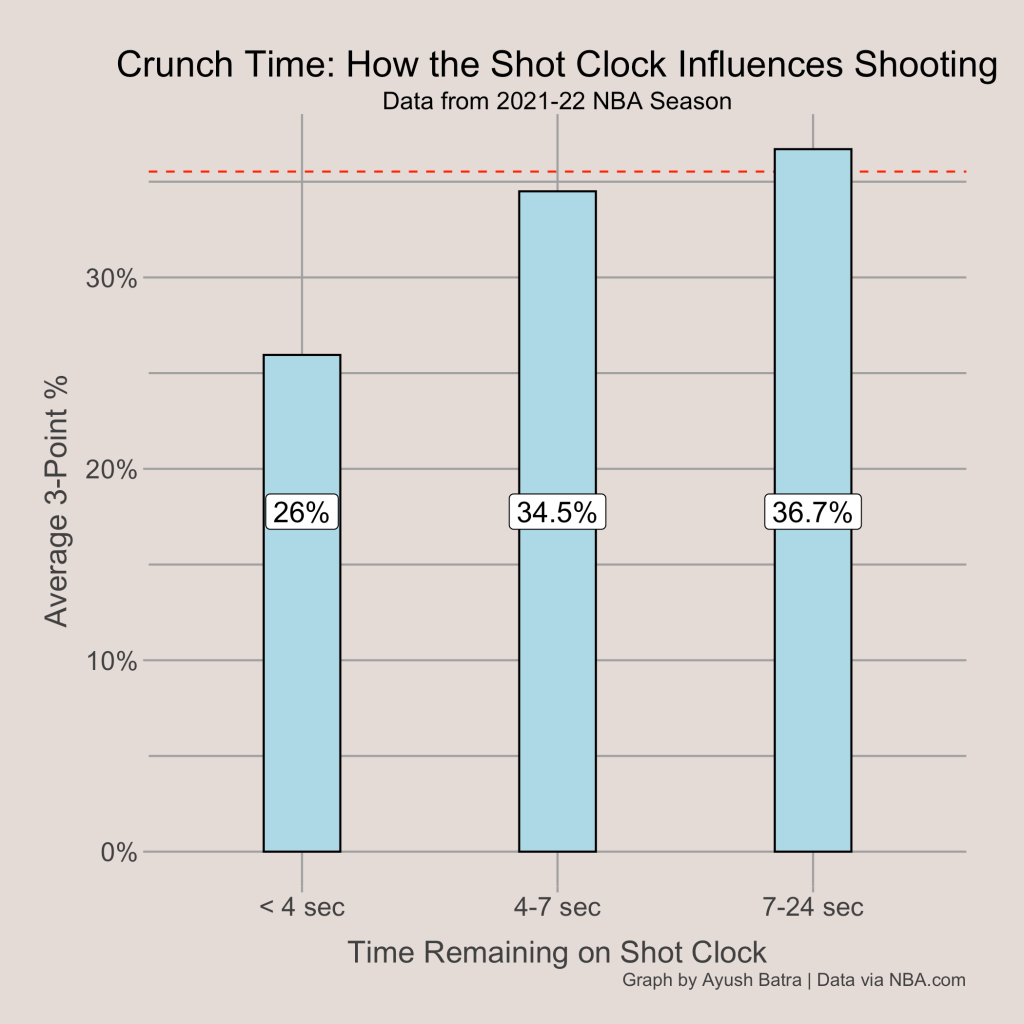
When a player has little time remaining on the shot clock to shoot the ball, he is often forced to put up a shot with a very low chance of going in, having little time to get set and ready for the shot. Three point attempts that come with little time left in the shot clock have a lower chance of going in because it causes rushed shots. As seen by the graph below, the NBA average 3-point percentage on 3-point attempts where the shot clock had less than 4 seconds remaining was only 26%.
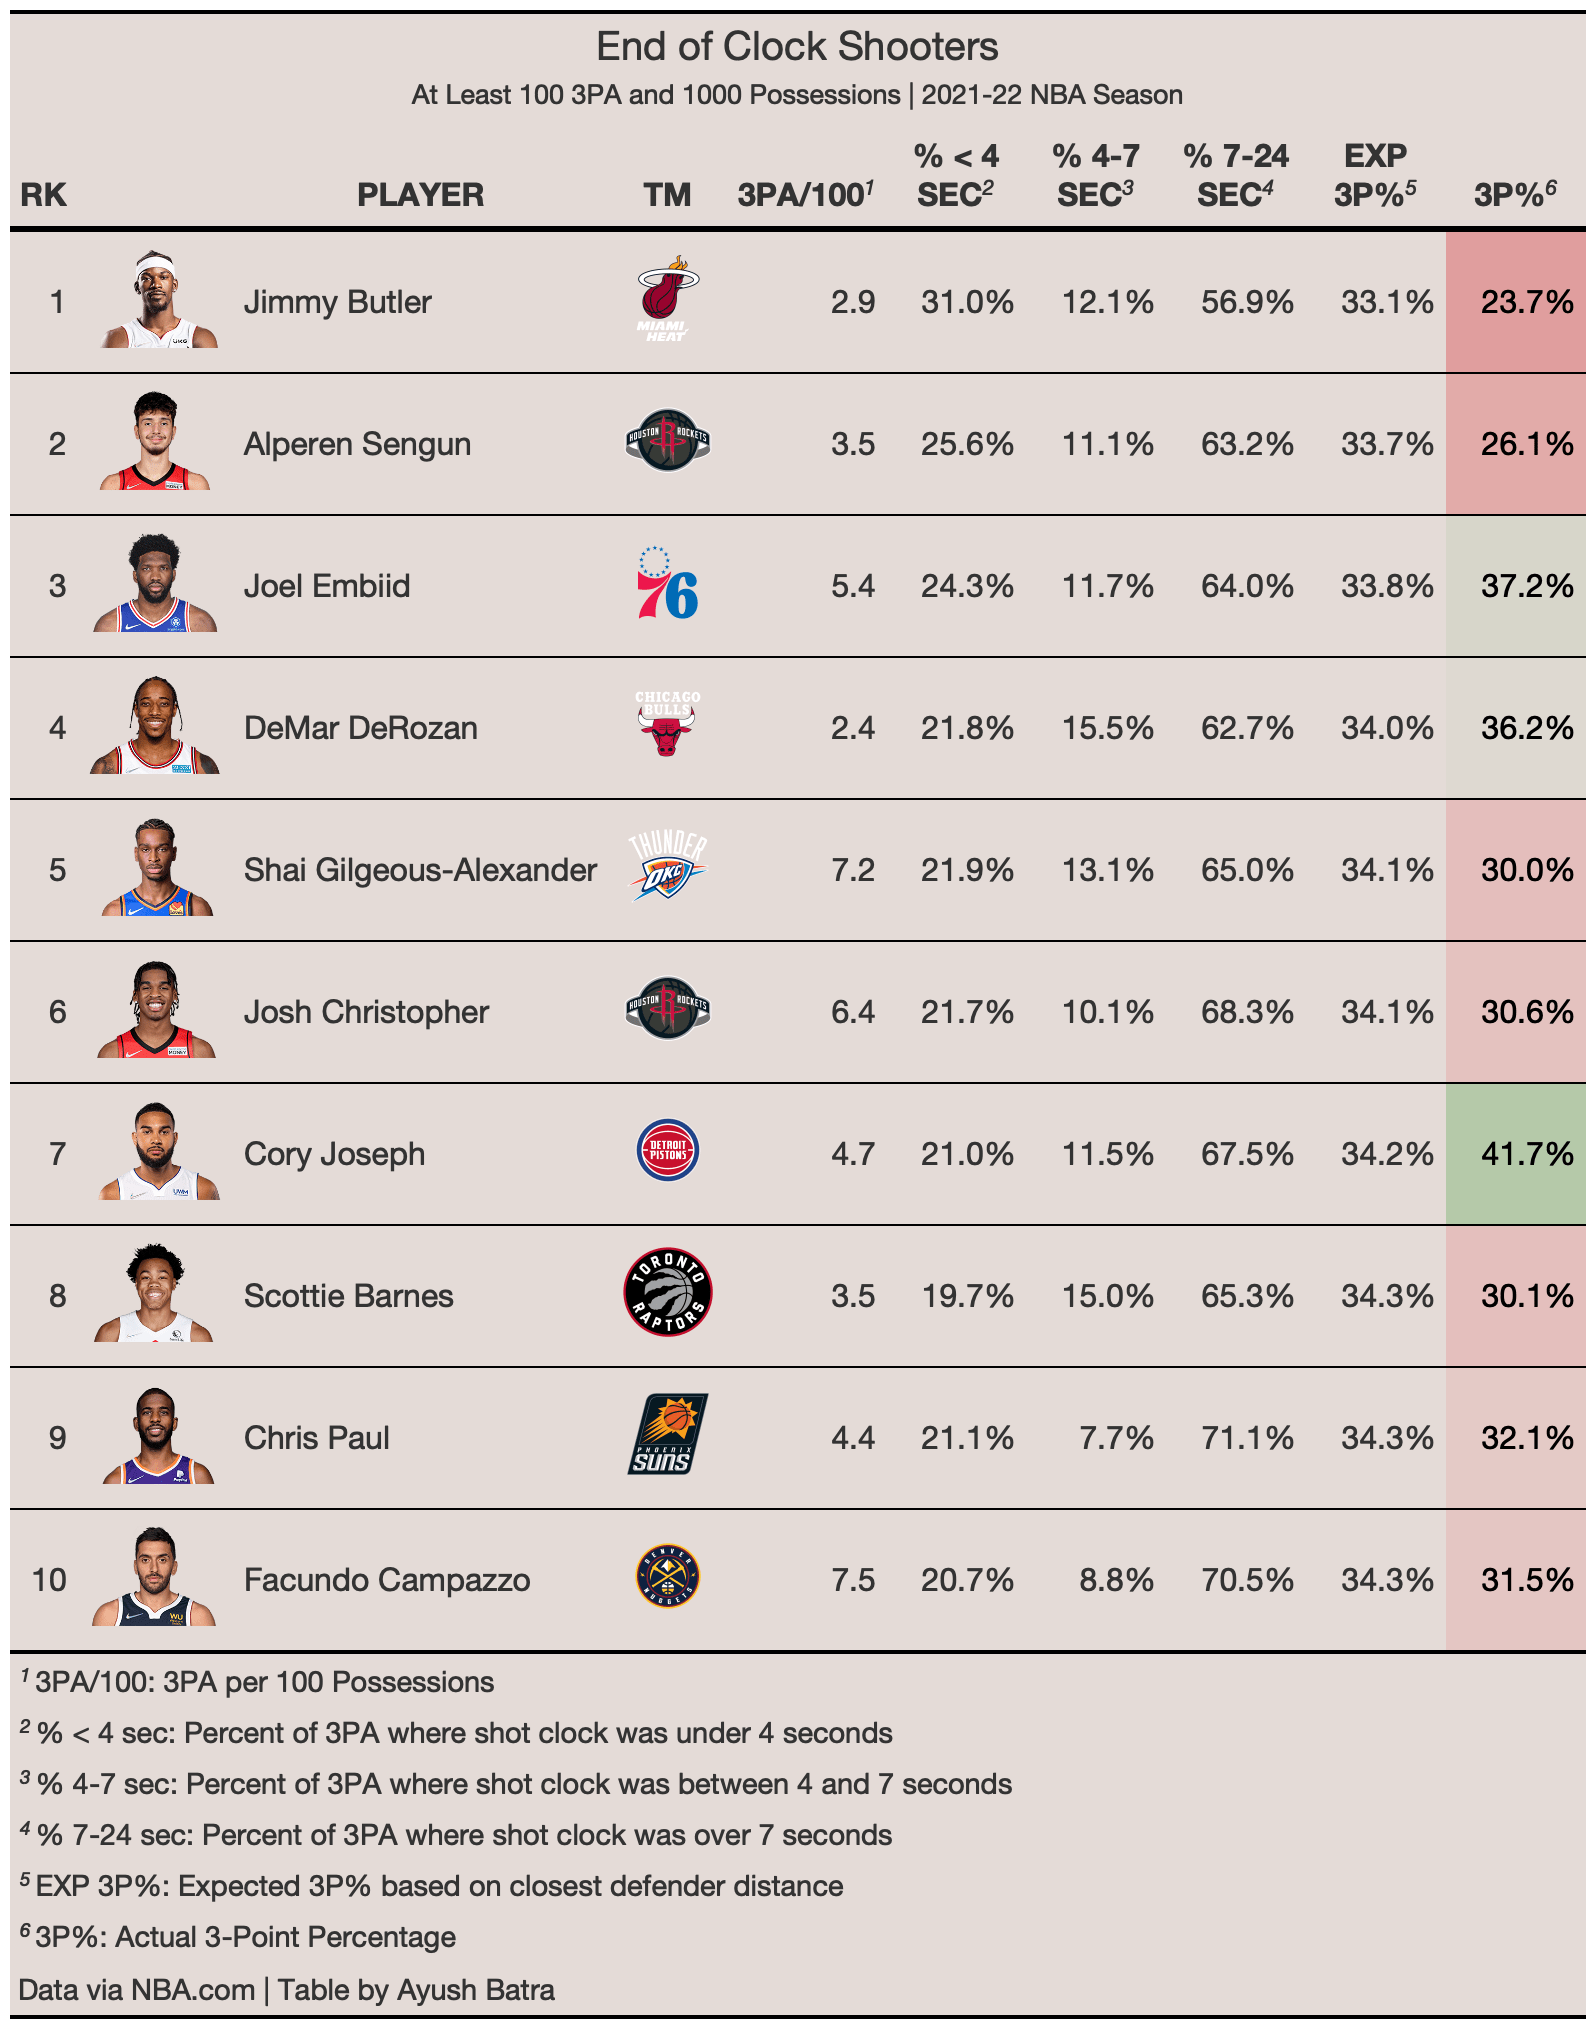
Certain players often take the assignment of creating for the team when the shot clock is winding down. Players like Jimmy Butler and Joel Embiid are commonly relied upon by their teams to get a good look with little time left. Because of this, they often have to take difficult shots from the perimeter just to avoid a shot clock violation, leading to more difficult 3-point attempts. It is important to realize that these players have a larger degree of difficulty in their 3-point attempts than others do. The table below shows the players with the lowest expected 3-point percentage based solely on shot clock remaining.
Shot Location
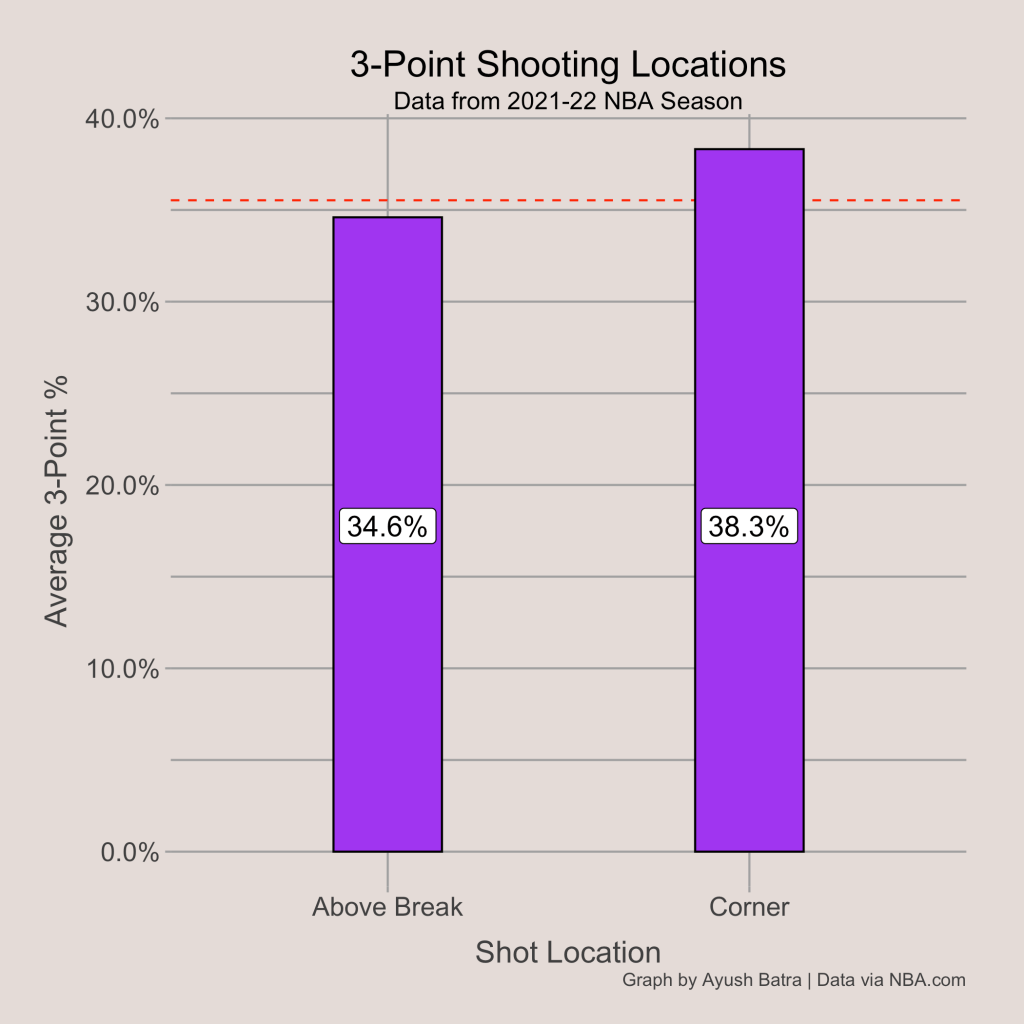
Not all 3-point attempts are created equal even from a distance standpoint. While most of the 3-point line is about 24 feet from the rim, a corner 3-point attempt can be just 22 feet. The decrease in distance obviously makes them easier shots, requiring less power to convert. In addition, corner 3’s are often uncovered and are taken as catch & shoot attempts. Three point attempts from the corners were made over 38% of the time last season, while above the break 3’s were made under 35% of the time.
Aside: Grouped vs Raw Data
I want to take a section to explain the data used in this article and some of the shortcomings with this type of data. The data I used to create the expected 3-point percentages above was grouped, meaning the raw data was put into bins and aggregated by similar values. For example, the data for closest defender distance for each player was represented as the total number of 3-pointers made and attempted that came with the closest defender at 4 different distances: 0-2 feet away, 2-4 feet, 4-6 feet, and 6+ feet. In reality, every single shot attempt has its own value of the closest defender distance.
The issue with grouped data is that it is difficult to use a regression to make conclusions. For example, see the graph below. When we look at the expected 3-point percentage based on the number of dribbles (catch & shoot vs pull-up), there seems to be no correlation despite the fact the pull-up shot attempts have a lower efficiency. The reason for this is quite simple: the best shooters are the ones taking the most difficult shots. Trae Young and Luka Doncic are great shooters, which is why they can afford to take more difficult pull-up shots. If we used a linear regression to try to predict the impact of dribbles on 3-point percentage, we would perceive that there is no effect because the correlation is so weak.

If I had access to raw data, this would not be an issue. The raw shooting data would include every single shot attempt from last season in addition to the actual number of dribbles, closest defender distance, shot clock remaining, and shot distance for each shot. There would not be any predetermined bins. If I had access to raw shooting data, I could run a logistic regression to calculate the probability of each shot attempt being made, then I could group by each player to find their expected field goal percentage and 3-point percentage. This would be a more accurate approach than the one I will use below. Unfortunately, the NBA does not release the raw shooting data anymore, instead only providing grouped data on their stats website.
Collinearity
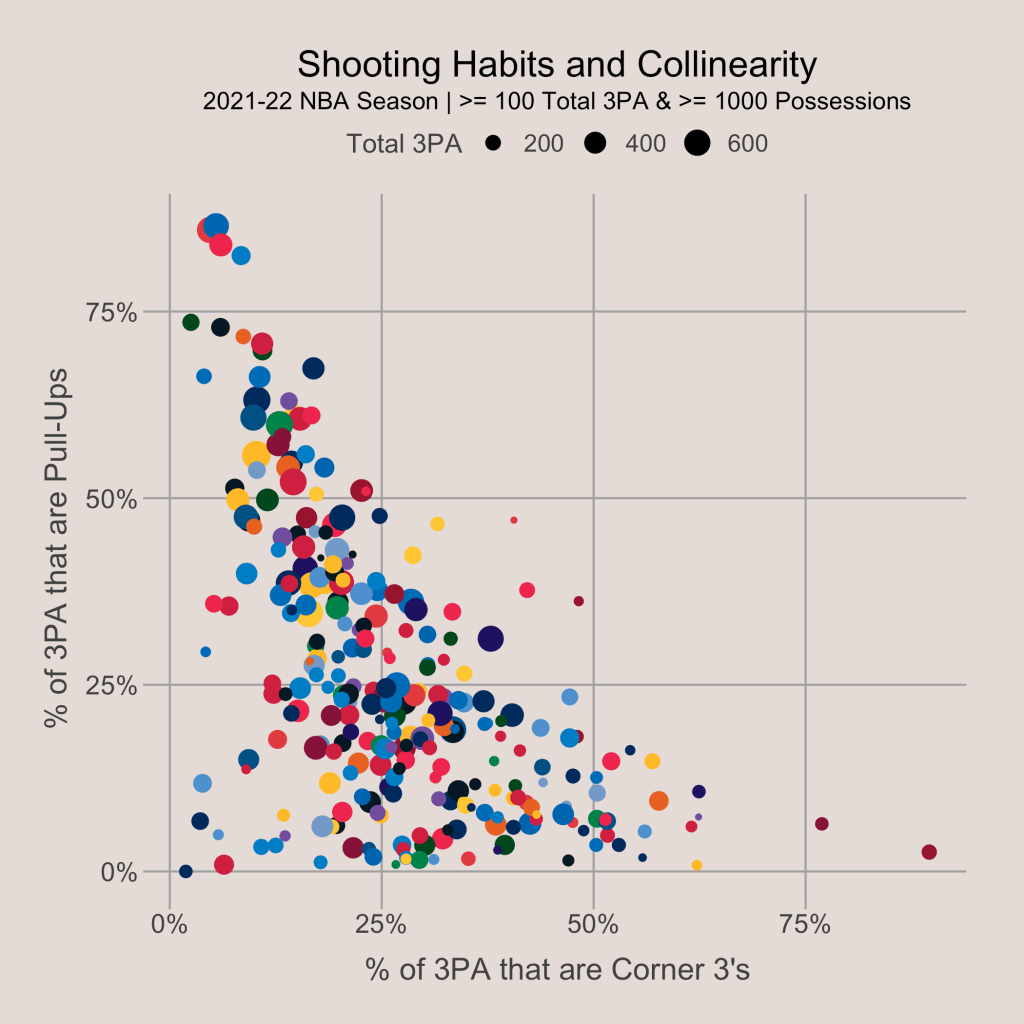
Unfortunately, there is another issue with the data: collinearity. The presence of collinearity means that two or more of the variables have a relationship, preventing them from being independent. For example, take shot location against the number of dribbles. If we look at the proportion of 3-point attempts that came as pull-ups against the proportion of attempts from the corner, there is an obvious negative relationship. This prevents us from treating the variables as independent.
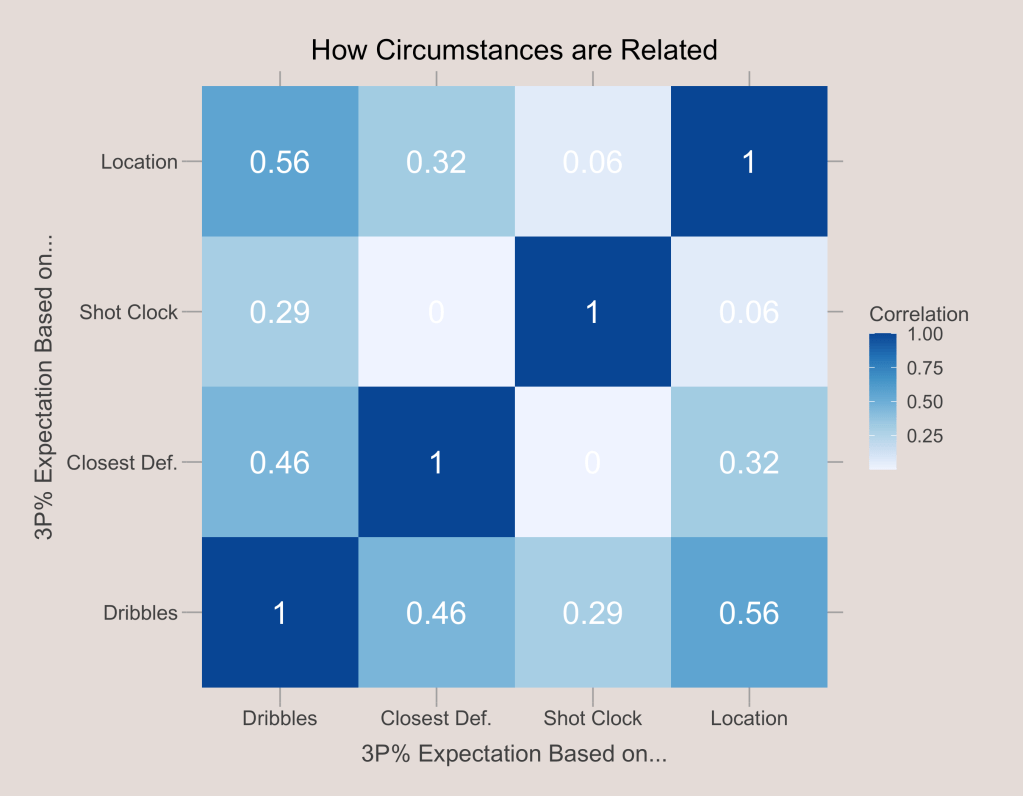
Using a correlation matrix, we can find the relationship between each of the 4 variables used. This finds the correlations between all combinations of the 4 variables. The results are shown below. We can see that the two most interconnected variables are location and number of dribbles, while closest defender distance is also significantly related to the number of dribbles. Fortunately, there are some variables that look like they are independent: shot clock looks to be independent from both the closest defender distance and shot location.
Overall Expected 3-Point Percentage
Note: You might want to skip down to the next graph if you want to avoid math
The presence of collinearity makes the overall expected 3-point percentage calculation somewhat messy. If all the variables were independent, I could simply add their effects to produce an overall expectation. However, due to the associations between some of the variables, this approach would overcount specific effects.
Here is a step-by-step process of how I calculated the expected 3-point percentage. It may make complete sense mathematically, but this was the only I could think of to combine all the variables since a linear regression won’t work.
- convert all the expectations based off a single variable into their log odds [ Log odds: ln(x/(1-x)) where x is the percentage represented as a decimal]
- calculate the NBA average 3-point percentage log odds (using same formula above)
- Find the difference between the log odds of the expectation of a single variable from the NBA average 3-point log odds [ formula: ln(a/(1-a)) – ln(b/(1-b)) where a is the expected 3-point percentage based off one variable and b is the NBA league average 3-point percentage ]
- Calculate the variable modifiers using the formula 1 – (cor_a + cor_b + cor_c)/3 [ where cor_a, cor_b, and cor_c are the correlations of the variable in question with the other 3 variables used; the modifier for dribbles was 0.564, the modifier for closest defender was 0.743, the modifier for shot clock was 0.882, and the modifier for location was 0.690 ]
- Multiply the variable modifier by the difference between the log odds of the expectation and the league average log odds
- Add up the values from each variable for the step above
- Add the NBA average 3-point log odds
- Use the sigmoid function to get the final expected 3-point percentage [ exp(x)/(1 + exp(x) where x is the value after doing the above steps ]
Here’s a simple explanation for why I did some of these things:
- I used log odds instead of the actual percentages in order to avoid expectations below 0%
- I found the difference between the single variable log odds and league average log odds to get the impact of each variable on its own
- I created the variable modifiers in order to give variables with lots of collinearity less of an impact than others
- I added all the values to get the aggregate effect of each variable, then added the NBA average log odds to be able to convert back into a percentage
True Shooting Ability
Now, there are a few more calculations that need to be done to find each player’s true shooting ability. I will use the same layout as the previous section. Here are the steps:
- Calculate the log odds of the player’s actual 3-point percentage (using same formula above; if a player had a percentage equal to 0% or 100%, I added one 3-point made or missed to get a non-zero value)
- Calculate log odds of the player’s expected 3-point percenage (which was calculated in the previous section)
- Calculate the difference by subtracting the log odds of the expectation from the log odds of the actual 3-point percentage, then add the league average log odds
- Find the Unadjusted Ability by applying the sigmoid function to the new log odds from the previous calculation (using same formula as previous section)
- Calculate the Volume Modifier with the following formula [ Mod = (2/(1 + exp(-FG3A_100)) – 1) where FG3A_100 is the 3-point attempts per 100 possessions ]
- Calculate the final True Shooting Ability by multiplying the Volume Modifier with the Unadjusted Ability
Again, some explanations:
- I used log odds again to avoid an ability below 0%
- I found the difference then added the league average log odds in order to create a new log odds that represents the expectation
- I created a volume modifier in order to decrease the abilities of players that took a very low number of 3-point attempts (this idea was borrowed from Ben Taylor with his 3-point proficiency calculation)
All right, now that we are done with the math, let’s look at how the 3-point expectation compares to actual 3-point percentage for some high volume shooters. The graph below shows this relationship, although there is inherent selection bias since all the players included shot many 3’s (to make sure the graph wasn’t too cluttered). That is why the majority of the players lie above the red dotted line representing an equal expected and actual 3-point percentage. If we looked at all the players in the sample, the results would be more balanced.
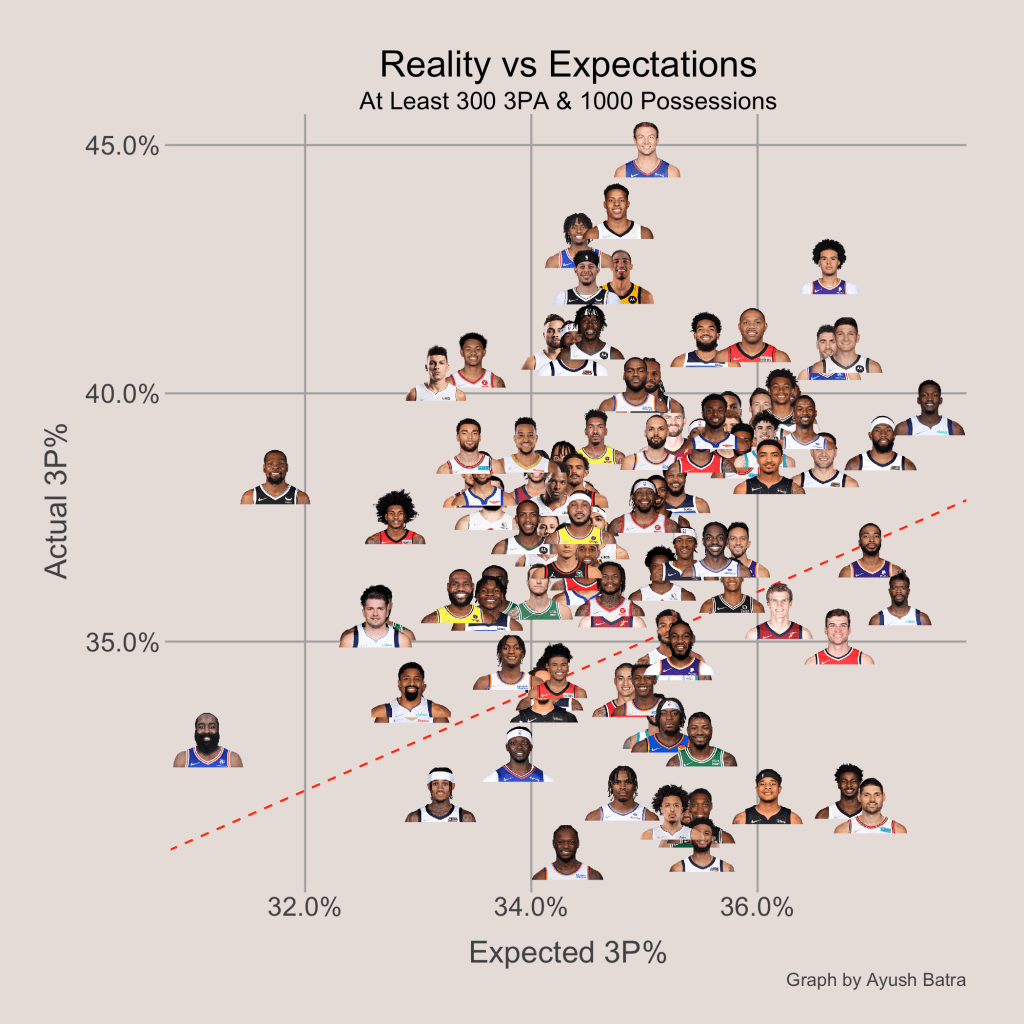
From the graph above, we can detect some players benefitting from easy 3-point shooting attempts. Cameron Johnson may have a 3-point percentage comparable to players like Desmond Bane, Tyrese Maxey, and Tyrese Haliburton, but his attempts are far less difficult. A better example of the importance of accounting for situation is by looking at the values for CJ McCollum and Royce O’Neale (they’re kind of hard to find on the graph, so I’ll tell you their stats). Both have an actual 3-point percentage close to 39%, but McCollum’s expectation is just 34% while O’Neale’s is about 37%. For this reason, McCollum and O’Neale differ greatly in True Shooting Ability, with McCollum being ranked in the 91st percentile while O’Neale is in the 72nd (still good, but not nearly as good as McCollum).
Lastly, two more players that stick out are Kevin Durant and James Harden. Both take really difficult shots, but both are also above average (or in Durant’s case, really good) shooters. In fact, Kevin Durant’s True Shooting Ability is better than Cam Johnson’s even though Durant’s actual 3-point percentage is over 4 percentage points lower (don’t get me wrong though, Johnson is still a great shooter).

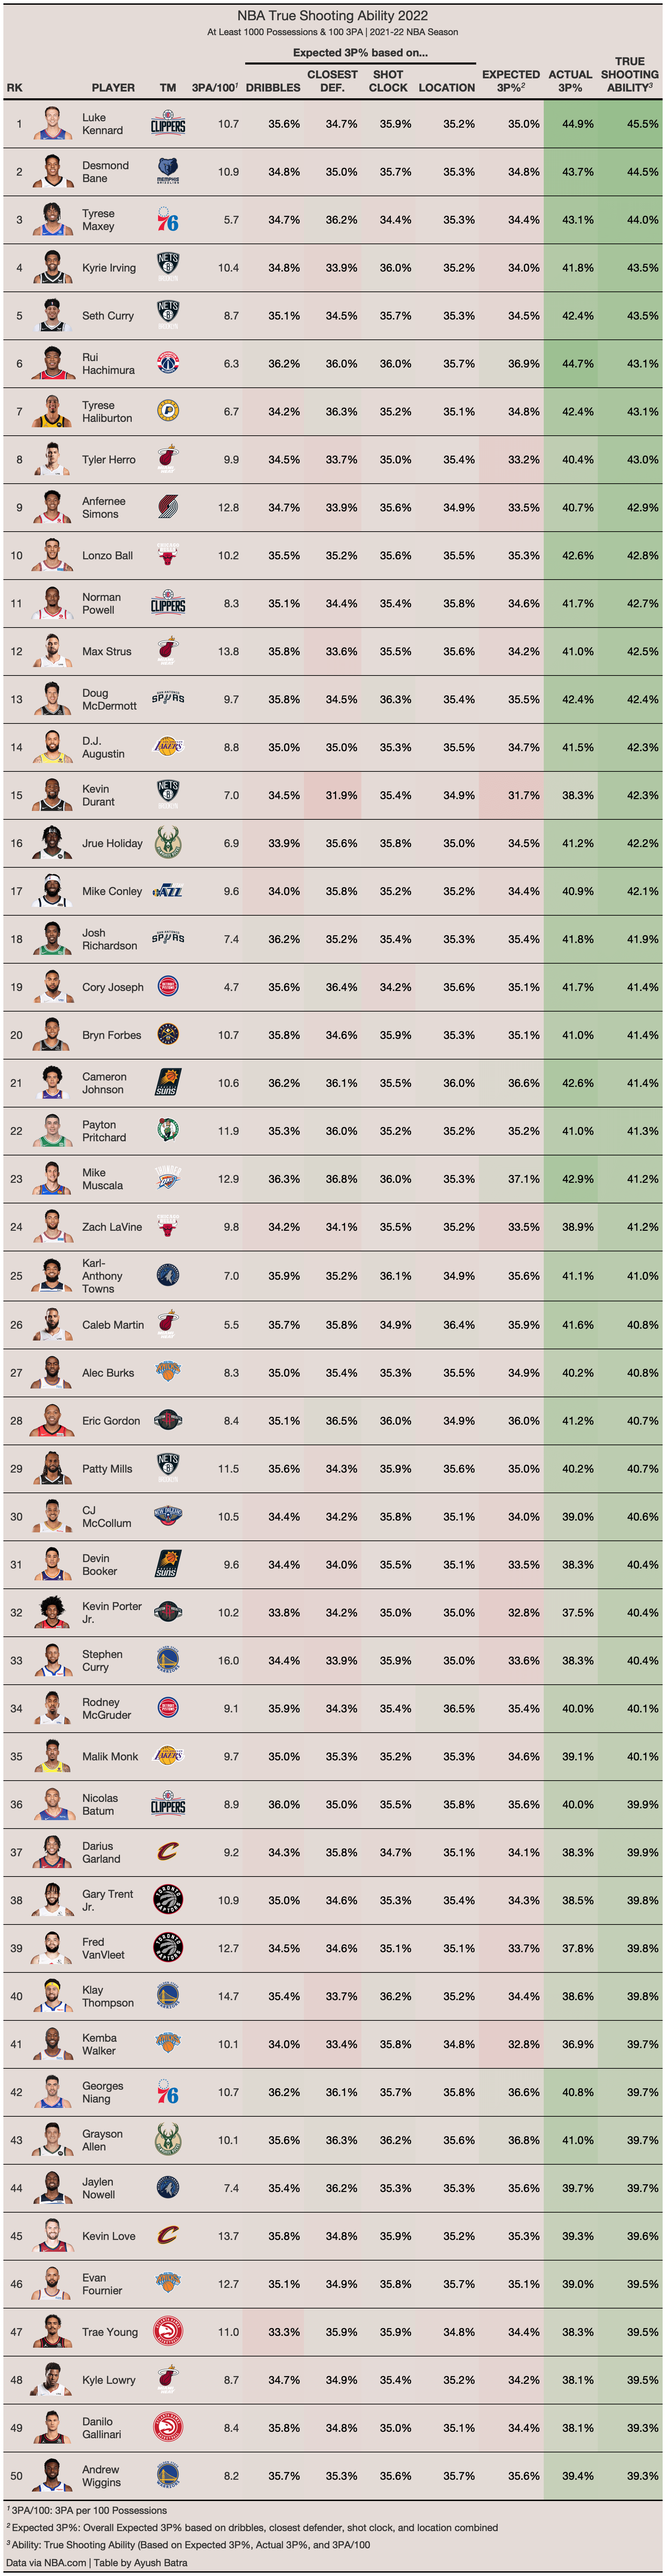
In the table below, you can see the top 50 shooters in the NBA last season according to True Shooting Ability (minimum of 1000 possessions and 100 3-point attempts).
Team Shooting
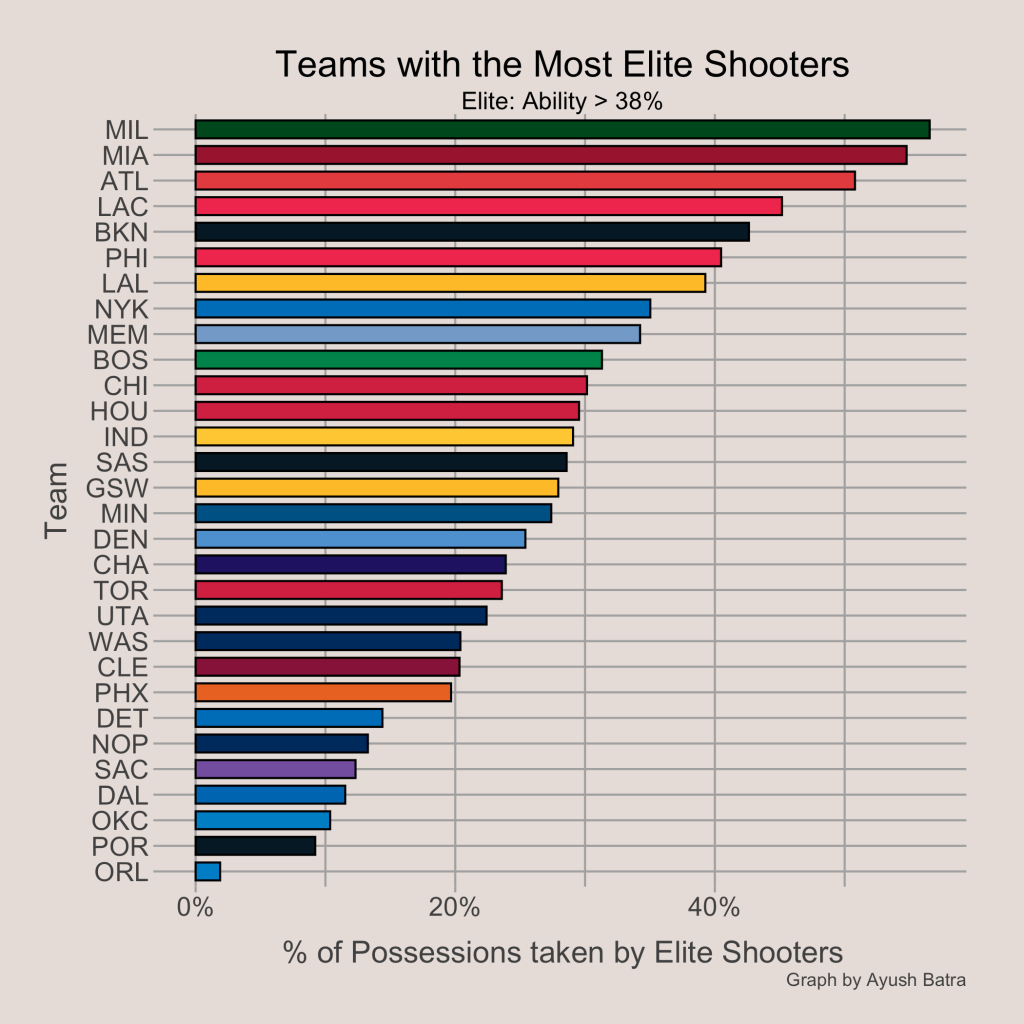
In this section, I will quickly demonstrate the importance of shooting on offensive performance at the team level. First, let’s take a look at the importance of elite shooters. I classified an elite shooter as a player with a True Shooting Ability above 38%. This represents about the top quartile of True Shooting Ability among players with at least 1000 possessions. The teams with the most minutes allocated to elite shooters last season included the Bucks, Heat, and Hawks.
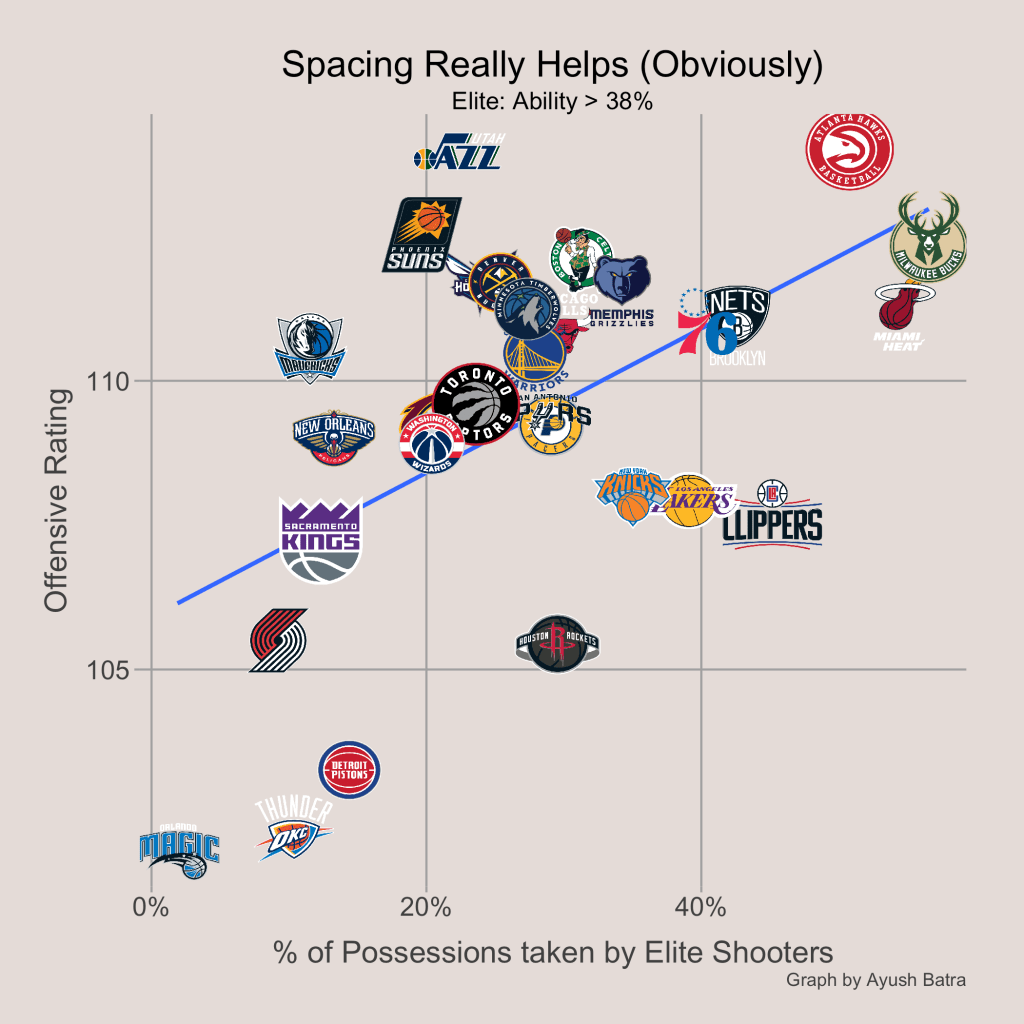
As seen below, there is a strong positive relationship between the proportion of minutes allocated to elite shooters and a team’s offensive rating. In my opinion, this relationship suggests that a team’s offensive performance depends not only on a central star’s ability to create shots, but also on a team’s overall spacing and ability to convert efficiently on opportunities. Basically, teams need to have role players that can shoot!
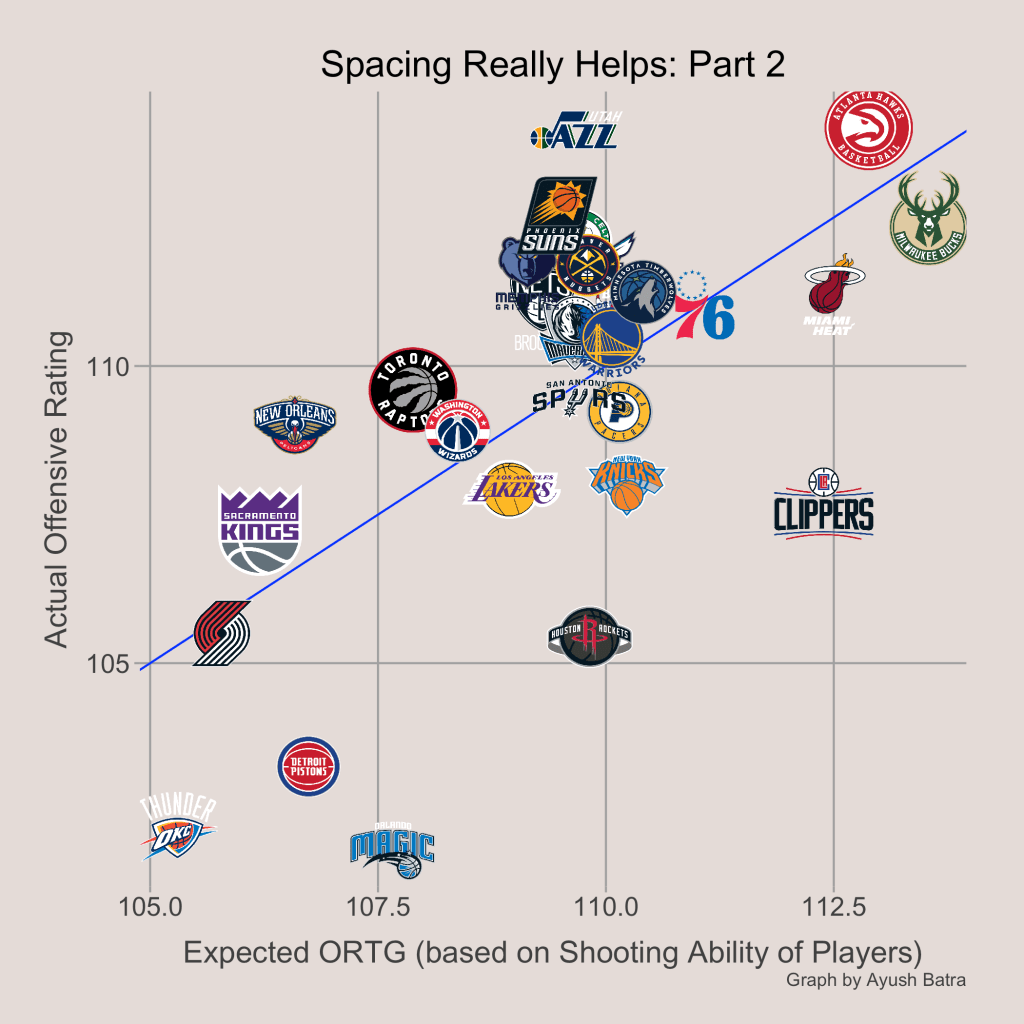
To further analyze a team’s shooting ability, we can create an expected offensive rating based on the percentage of elite shooters (True Shooting Ability > 38%), good shooters (True Shooting Ability > 34%), and bad shooters (True Shooting Ability < 30%). This gives a good idea of the overall shooting ability of a team.
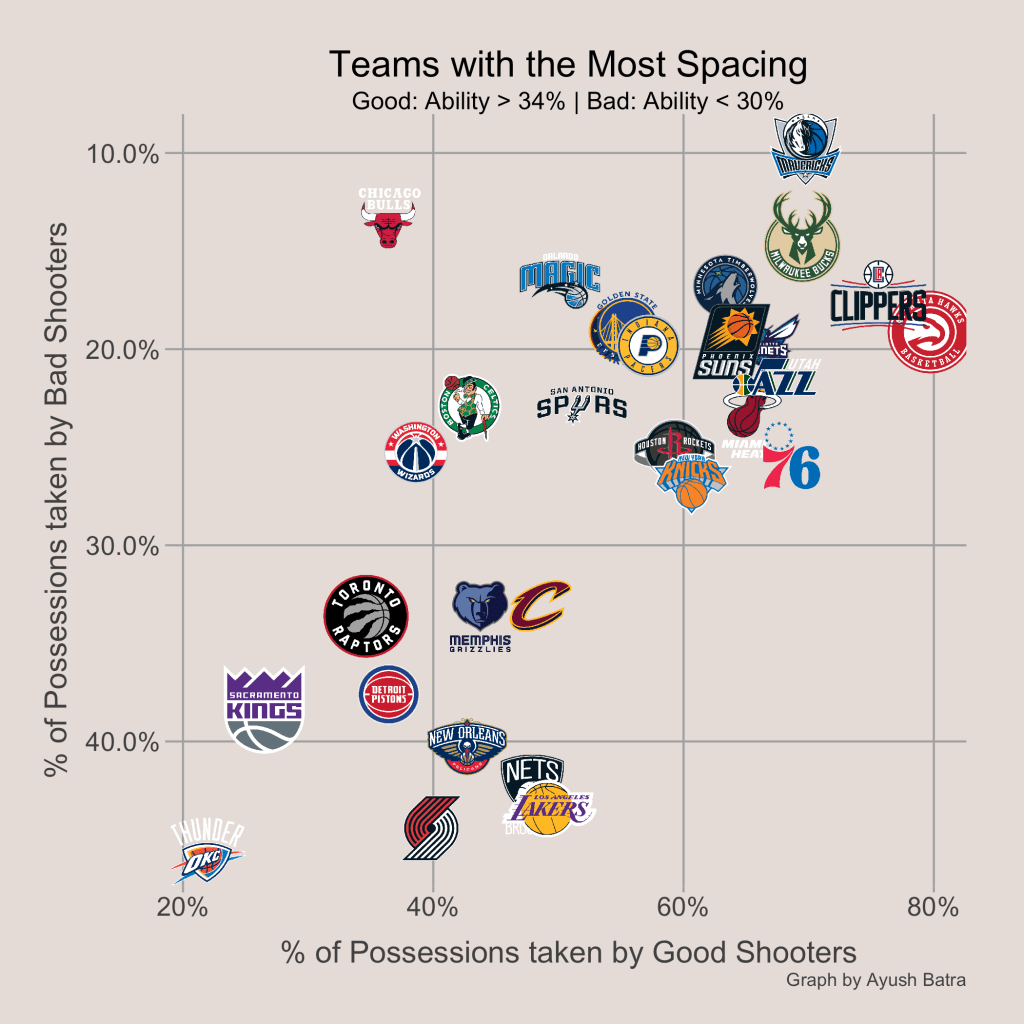
The graph above displays the proportion of minutes taken by good shooters against the proportion of minutes allocated to bad shooters, while the graph below shows the expected offensive rating based on each team’s proportion of elite, good, and bad shooters. We can immediately see that the Bucks, Hawks, Heat, and Clippers had great shooting and were expected to very efficient offensively. The Clippers fell short, mainly due to a low 2-point efficiency and poor offensive rebounding, but the Hawks and Bucks had top 5 offenses.
Summary
In order to determine which players are the best shooters in the NBA, we have to look further than just 3-point percentage. By accounting for the number of dribbles, closest defender distance, shot clock remaining, shot location, and 3-point volume, a player’s True Shooting Ability provides the best metric for determining which players would have the best 3-point percentages given a league average difficulty of 3-point attempts. Additionally, it is clear that great spacing helps an offense immensely. Teams with a large proportion of minutes allocated to elite shooters are expected to have great offenses given they don’t turn the ball over too much or fail to crash the offensive boards. In my opinion, this finding indicates that an offense’s efficiency depends not only on the ability of star players to create shots, but also on the ability of role players to capitalize off easy shots and provide spacing for more drives and attacks at the rim. The best way to find the NBA’s top shooters is to account for both efficiency and the difficulty of the shots taken.

Nicely done with good explanations
LikeLike