
It’s a common scenario in football. A team has the ball, trailing by one possession with limited time. They have to drive down the field in order to score and tie the game or take the lead. Without a score, the team will squander a game in which they had a chance to win. Countless NFL quarterbacks have encountered this experience, where they have to level up their play in order to propel their team to victory. Quarterbacks can be made or broken in these situations. Legendary quarterbacks, like Peyton Manning, Tom Brady, and Aaron Rodgers (and soon Patrick Mahomes) have consistently led their teams to comeback victories in clutch situations, making teams fear giving them the ball no matter how much time is left in the game. We can find which quarterbacks are the best in the clutch, which quarterbacks improve the most, and how consistent clutch performance is using statistics.
Methods
In order to evaluate QB efficiency, I utilized expected points added. A full explanation of expected points added (or EPA for short) can be found here, but in summary, it uses points instead of yards as a measurement of performance. EPA is the difference between the expected points (based on down, distance, and yard line) before the play and the expected points after the play (so a positive value is good and a negative value is bad).
I defined clutch plays as those when the game was under five minutes in the 4th quarter, the offense’s win probability was greater than 20%, and the offensive team was trailing or tied. Because of the requirements, quarterbacks have only a few clutch (typically less than 40 plays) plays per season.
Best Clutch QBs
Using Expected Points Added per Play, we can compare NFL quarterbacks’ efficiency in clutch situations compared to non-clutch situations. The graph below accounts for EPA from passing, rushing, sacks, and turnovers.
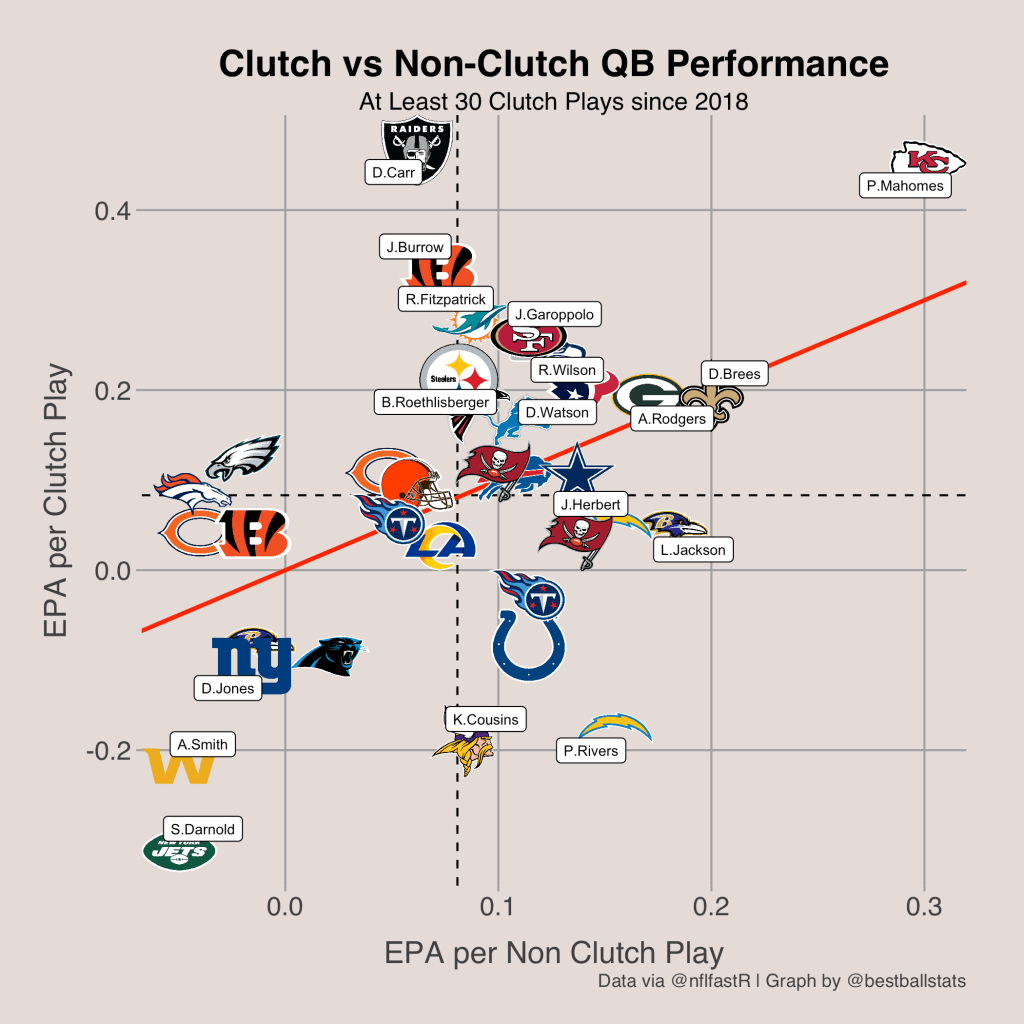
Looking at the graph, we can quickly see which quarterbacks are the best in clutch and non-clutch situations. In general plays, Patrick Mahomes far outplays any other quarterback, averaging 0.30 EPA/Play. To contextualize this value, you can think of it as Mahomes adding about 0.30 points over an average quarterback in a single play. Mahomes is followed in non-clutch efficiency by other quarterbacks that are commonly regarded as some of the best, including Drew Brees, Aaron Rodgers, and Lamar Jackson.
However, things change when the game enters clutch time. While Mahomes is still near the top in terms of efficiency, he is actually not in first. Rather, Derek Carr has been the most efficient quarterback in the clutch. Carr has 13 game winning drives since 2018, the most of any quarterback in the NFL. When the Raiders find themselves needing a comeback, they know they can count on Carr to come through. In addition to Derek Carr, other efficient clutch quarterbacks include Joe Burrow, Ryan Fitzpatrick, Russell Wilson, and Jimmy Garoppolo. While Mahomes is obviously the best quarterback in the NFL, when someone asks you what quarterback you want in the clutch, you might want to say Derek Carr.
Another way to look at quarterback performance in the clutch is to compare explosive plays against negative plays. An explosive play is defined as a play that gains 20 or more yards, while a negative play is one that ends in a turnover or sack. While this is not as comprehensive as EPA/Play, it can still reveal some interesting findings. For example, take a look at Deshaun Watson’s place on the graph below.
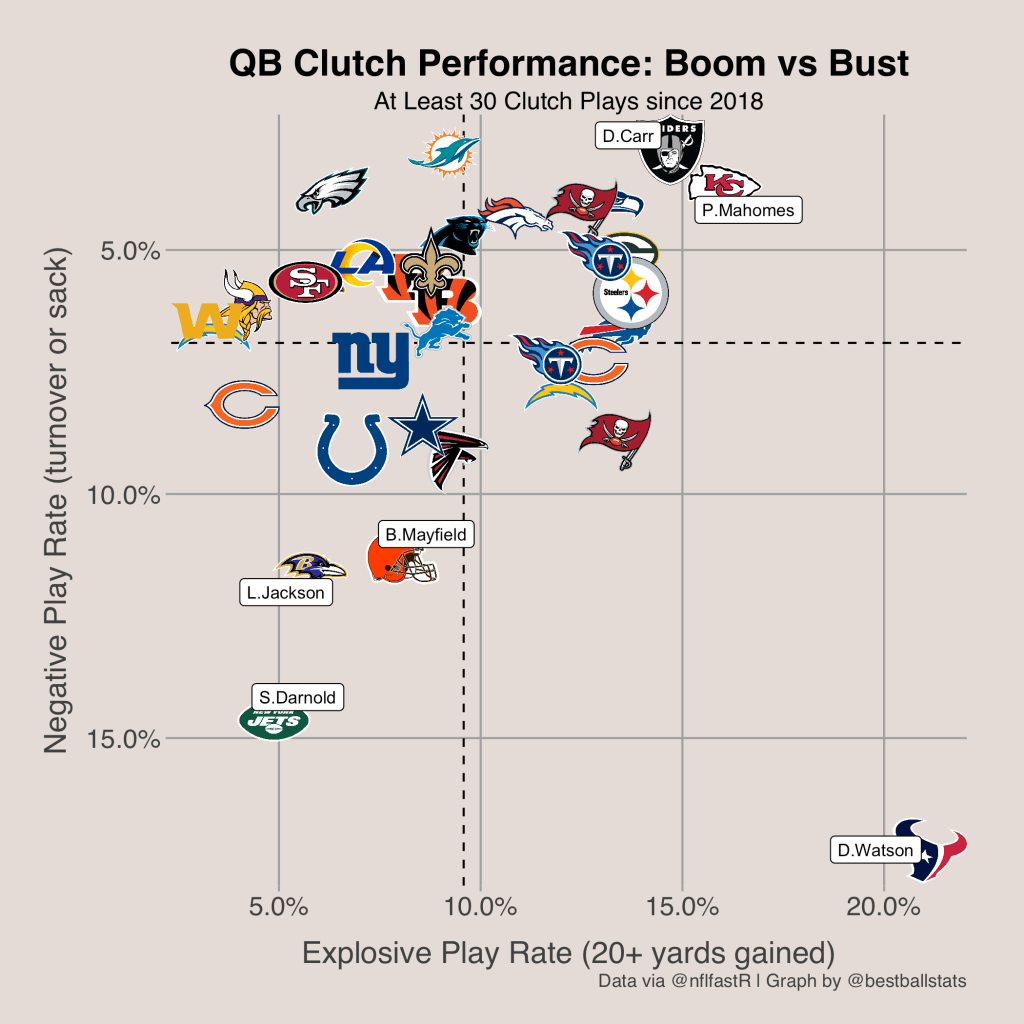
Deshaun Watson is a huge outlier on the graph. While there seems to be an overall negative association between explosive play rate and negative play rate (notice the y-axis is flipped), Deshaun Watson actually ranks 1st in both categories. Watson has both the greatest explosive play rate and the highest negative play rate. This means that when Deshaun Watson plays in the clutch, it is very entertaining. On about 38% of plays, Deshaun Watson will either have a big gain, turnover, or sack. Because of his high frequency of both explosive and negative plays, we can infer that Deshaun Watson has a huge variance in clutch efficiency. Just know that next time you see Deshaun Watson playing in the clutch, it will probably be worth a watch.
QBs that Improve in the Clutch
While the previous graphs give a good idea of which quarterbacks actually become more efficient in the clutch, they do not provide an exact statistical method of determining the difference between clutch and non-clutch efficiency. In order to determine which quarterbacks improve in the clutch, I used a one-tailed test for a difference in means, where the null hypothesis was that clutch and non-clutch efficiency are equal and the alternative hypothesis was clutch efficiency is greater than non-clutch efficiency. The results of the t-test with the 8 qualifying quarterbacks with the lowest p-value are shown below.
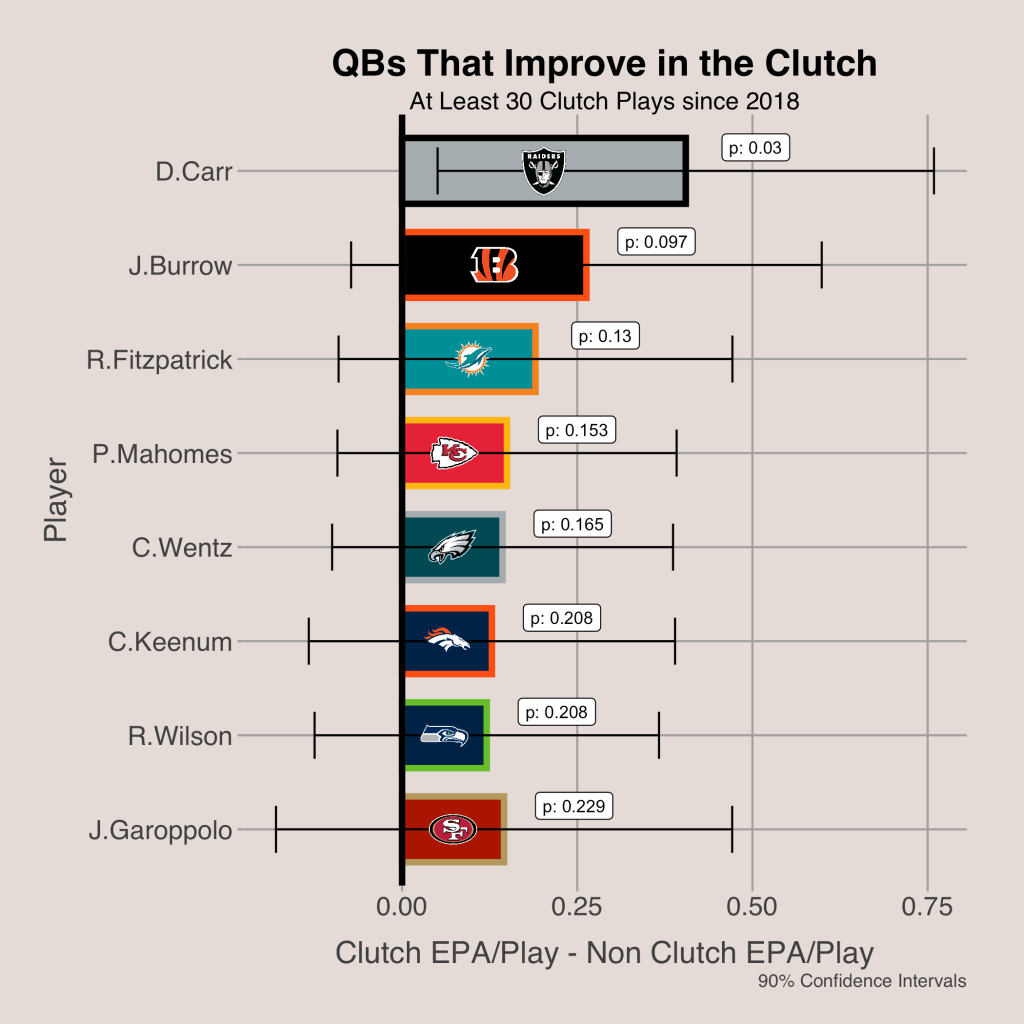
By analyzing the results of the t-tests, we can see that Derek Carr is in fact the quarterback who improves the most in the clutch. Carr’s p-value of 0.03 means that there is a 3% chance that he could have had his boost in efficiency in the clutch based on random chance alone assuming the null hypothesis. Carr was the only quarterback in the sample of 35 that had a mean difference in clutch and non-clutch EPA/Play that was statistically significantly greater than 0 at the 0.05 level. However, Joe Burrow, Ryan Fitzpatrick, Patrick Mahomes, and Carson Wentz have each played better in the clutch, even though their results are not statistically significant.
QBs that Decline in the Clutch
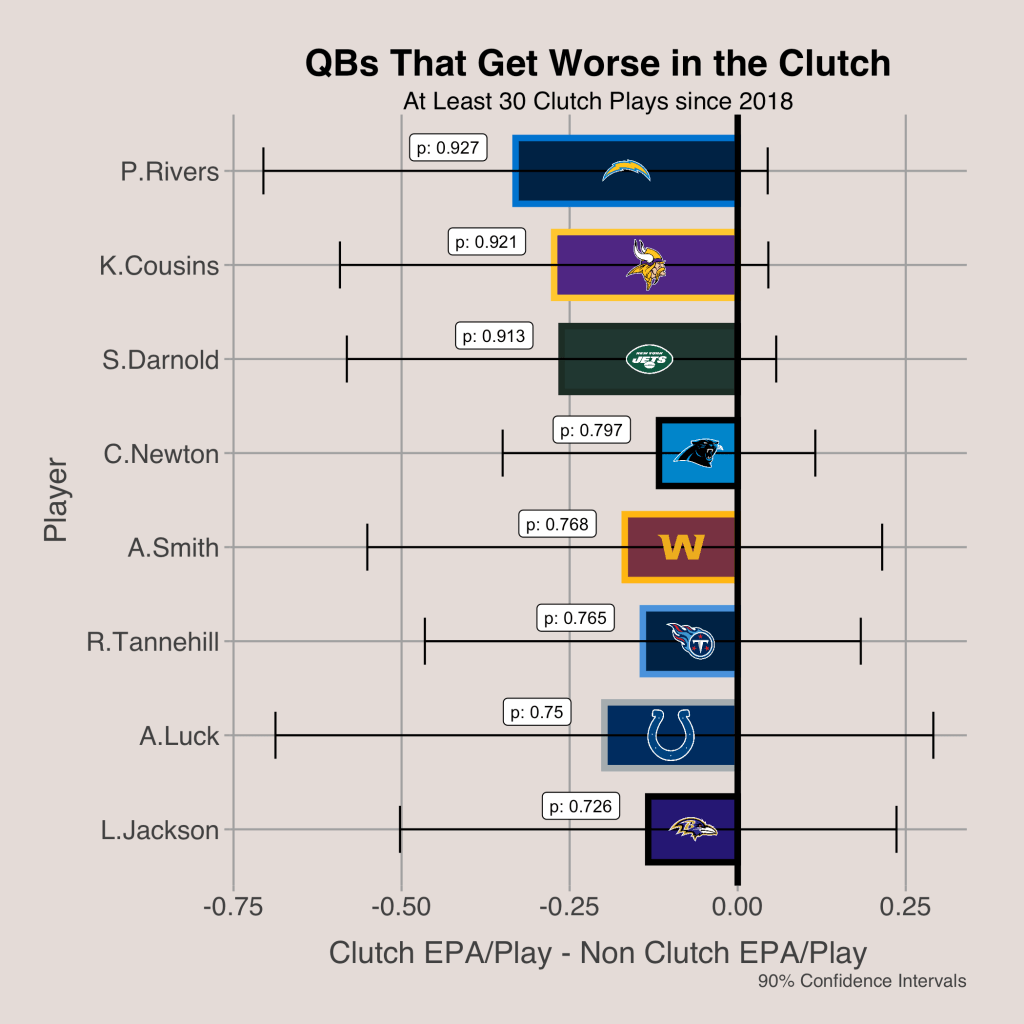
We can look at the quarterbacks with the greatest p-values (since it was a one-tailed test) to see the QBs that get worse in the clutch. Looking at the graph below, no quarterbacks in the sample had a difference in EPA/Play that was significantly less than 0 at the 0.05 level, but Philip Rivers and Kirk Cousins were the two quarterbacks that fell off the most in the clutch.
Clutch Consistency (or rather the lack thereof)
An important factor to account for when analyzing clutch performance is to examine the predictive value of clutch efficiency. If a specific stat has a high predictive value, it is good to use to evaluate quarterbacks. In order to examine the predictive value of clutch efficiency, we can measure the year to year correlation of clutch efficiency for quarterbacks. By comparing the year to year correlation of clutch efficiency to non-clutch efficiency, we can see the value of using clutch EPA/Play to evaluate quarterbacks.
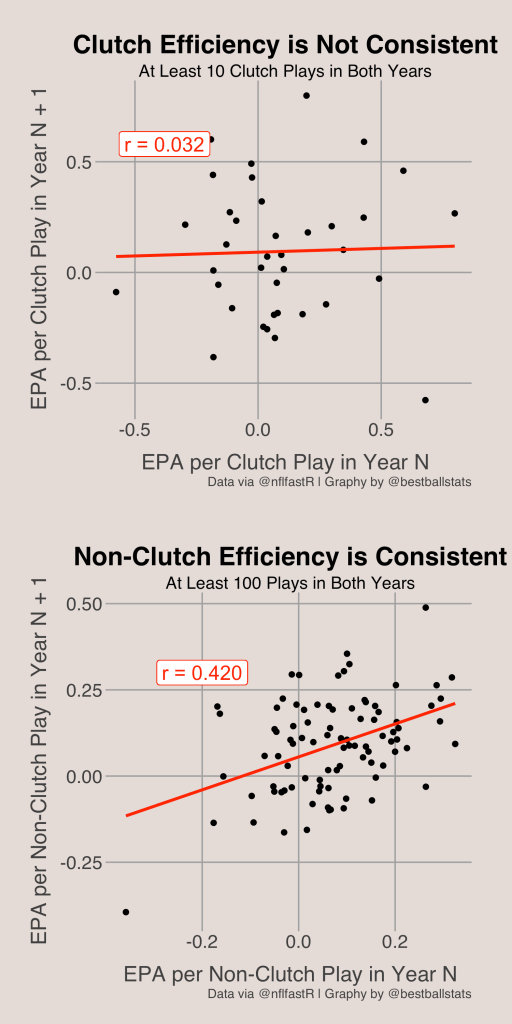
After plotting the year to year correlation of both clutch and non-clutch efficiency, we can clearly see that clutch efficiency is NOT a predictive stat. Therefore, we should not use clutch EPA/Play to determine which quarterbacks are good and which aren’t because it is very likely that the value will change a large amount from year to year. Using the r-squared from the clutch EPA/Play graph, only about 0.1% of the variance in QB clutch efficiency can be predicted by the clutch efficiency from the previous year. Although it is interesting to determine which quarterbacks play better in the clutch, it is best to not make any grand conclusions from clutch statistics since they are not consistent at all.
