

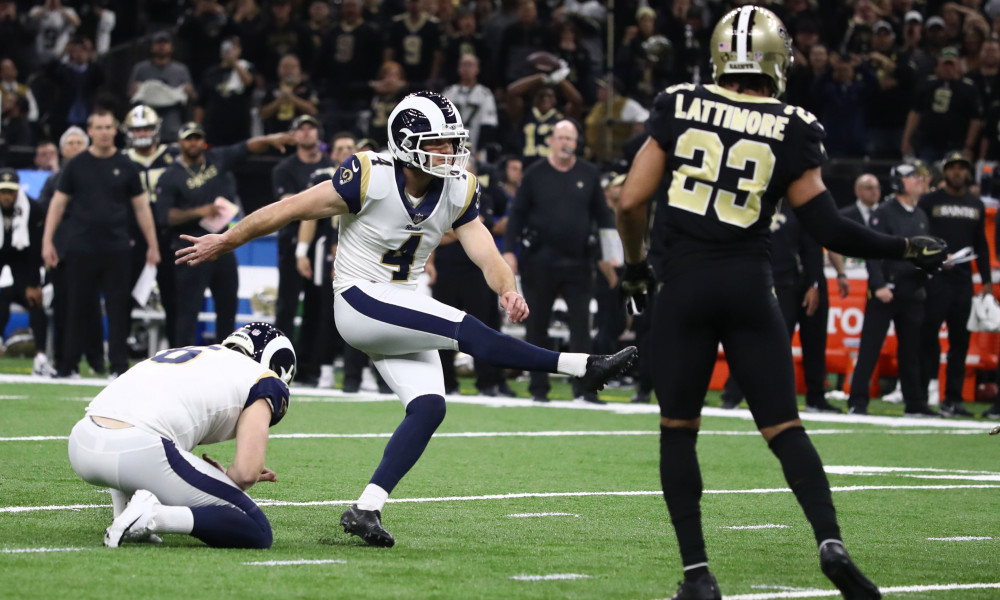
One of the most overlooked aspects of football is the kicking game. Almost no one pays attention to the kickers throughout a game barring an extraordinary bad performance unless there is a game on the line with a field goal attempt. An offense can march down the field and put their team in a good position to win, but it doesn’t matter if the kicker can’t score the field goal. Games on the biggest stages have been won with made field goals: the Patriots won Super Bowl XXXVI with Adam Vinatieri’s 48 yard field goal, the Patriots won Super Bowl XXXVII with Adam Vinatieri’s 41 yard field goal, and the Rams won the 2019 NFC Championship Game with Greg Zuerlein’s 57 yard field goal. However, equally as important games have been lost by missed field goals: The Bills lost Super Bowl XXV after Scott Norwood’s infamous “wide right” kick, the Ravens lost the 2012 AFC Championship Game after Billy Cundiff’s 32 yard miss, and the Bears lost their 2019 NFC Wildcard game after Cody Parkey’s 43 yard field goal bounced off both the left upright then the crossbar.

Kickers are a crucial part of the game of football. They have to kick after almost every touchdown and they get their teams points after drives that don’t quite end up in the endzone. The highest scoring player is a kicker almost every year. Without a reliable kicker, an NFL team will leave points on the board and potentially lose several games. However, the only stat to evaluate kickers in the NFL is field goal percentage. There is a problem in using only raw field goal percentage, as some kicks are easier to make (including short kicks or ones in ideal conditions) while others are very difficult (like kicks over 50 yards or in rainy and windy conditions). By using the distance of field goal attempts as well as the weather conditions surrounding the kicks, I can build a stat that better captures a kicker’s true performance better than raw field goal percentage.
Indoor Kicks
In order to truly evaluate kickers, I created field goal percentage over expected (abbreviated FGPOE from now on). This stat uses the kick distance, wind speed, and precipitation during the kick in order to estimate the percentage of kicks that a kicker should make, then subtracts that from the kicker’s actual field goal percentage. Using a sample of all 4,935 field goal attempts from the 2015 to 2019 seasons, I split the data into two different sets: indoor and outdoor. The chance of making a kick when playing outdoors include three variables: kick distance, wind speed, and precipitation. Meanwhile, the chance of making a kick indoors only depends on kick distance as wind speed and precipitation obviously have no impact.
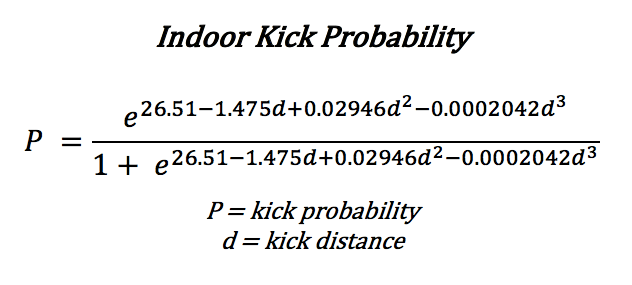
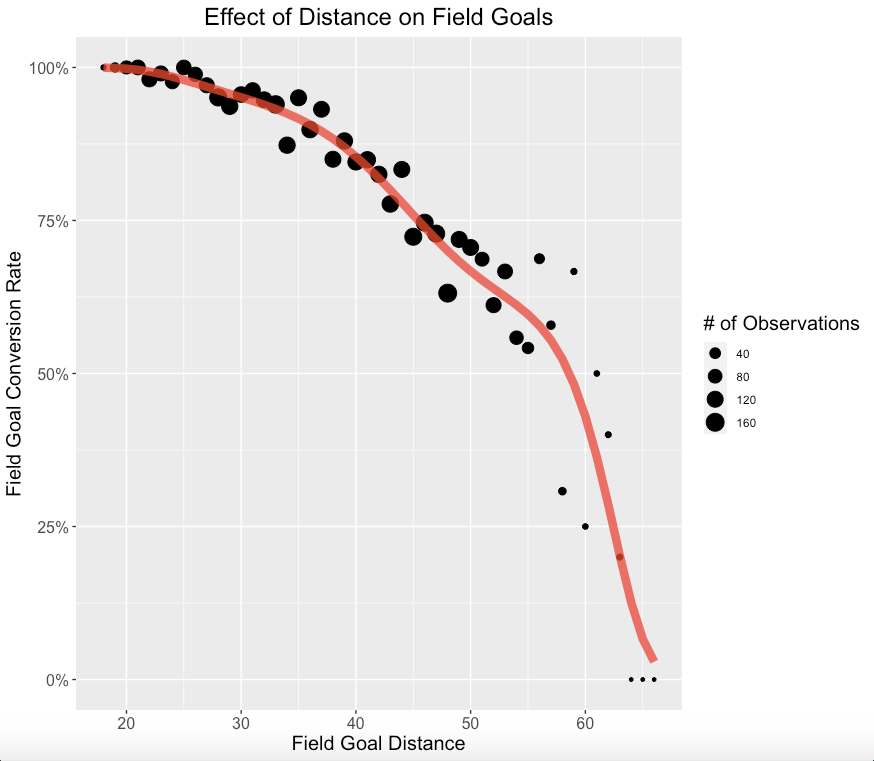
The sample for indoor kicks included 726 of the 4.935 total field goal attempts. By looking at the field goal percentage within groups of every two yards, it can be seen that the probability of making a field goal attempt indoors has a curved pattern. Therefore, I used a logistic regression to predict the probability of making a kick. The results of the logistic regression are shown below with the red line, along with the actual equation for the line below it. I had to use distance cubed in order to capture the true difficulty of longer yard field goals. Because of the low number of kicks from beyond 60 yards in the sample, the predictions for kicks longer than 60 yards are unreliable for this model.

Outdoor Kicks
Estimating the probability of making a field goal when kicking outdoors is more complicated than using indoors since weather variables have to be included. Although the dataset that I had included weather variables like windspeed, precipitation, humidity, dew point, temperature, and pressure, I only included windspeed and precipitation in order to make the regression as simple and meaningful as possible.
Exploring the Effect of Wind Speed
Windy conditions make kicking field goals much more difficult than in ideal conditions. Kickers have to account for the direction and strength of the wind in order to be sure the wind does not take the ball on an unintended path. However, different wind speeds have different effects on the difficulty of field goal attempts.
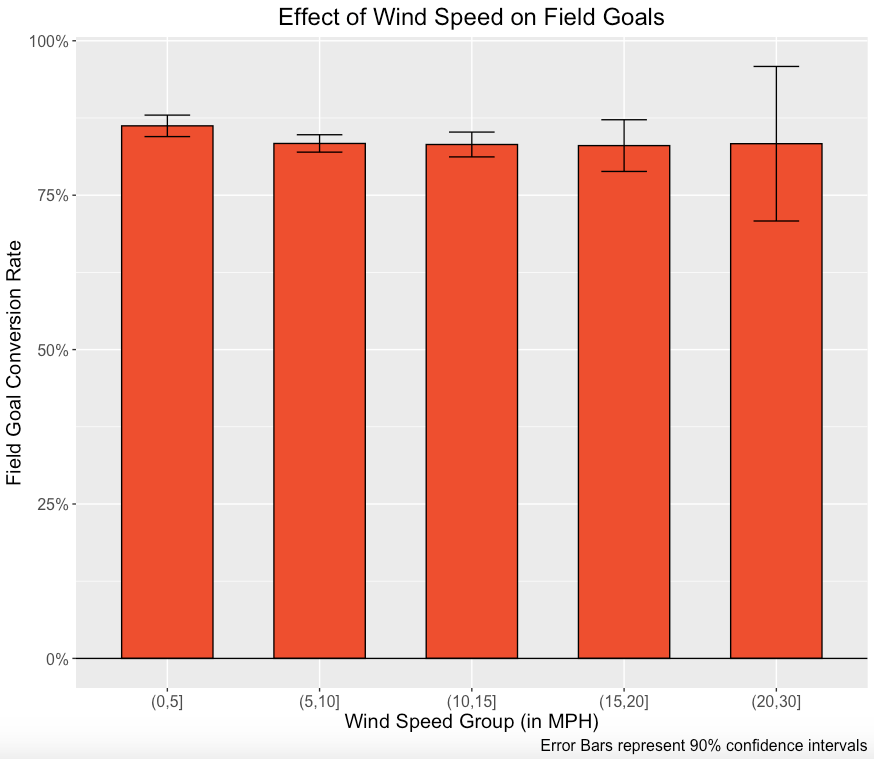
While it does not seem like wind speed has a large impact on field goal percentage, it is visible that field goals have a higher chance of being made when kicked in low wind speeds. Even though it is difficult to see, kicks in wind speeds below 5 MPH have a field goal percentage of 86.2%, which is significantly higher than the field goal percentage for kicks in wind speeds between 5 and 10 MPH (FG% = 83.4%, p-value for difference greater than zero equals 0.0203) and for those in wind speeds between 10 and 15 MPH (FG% = 83.2%, p-value for difference greater than zero equals 0.0305). The difference for field goal percentage for kicks in wind speeds in the group of 0 to 5 MPH is not significantly greater than for those in wind speeds between 15 and 20 MPH (FG% = 83.0) or those in wind speeds between 20 MPH and 30 MPH (FG% = 83.3%) as a result of the small sample of kicks in those groups. Additionally, even though the field goal percentage for kicks in very high wind speeds (between 20 and 30 MPH) does not seem very different than for those in lower wind speeds, it is important to note that the average kick distance of those attempts is 34.8 yards, lower than the average of around 38 yards for the four other groups.
Exploring the Effect of Precipitation
In addition to wind speed, the second important weather factor for outdoor kicks is precipitation. An accumulation of rain or snow during a game can make it difficult for the holder to set the kick and for kickers to kick the ball without slipping.
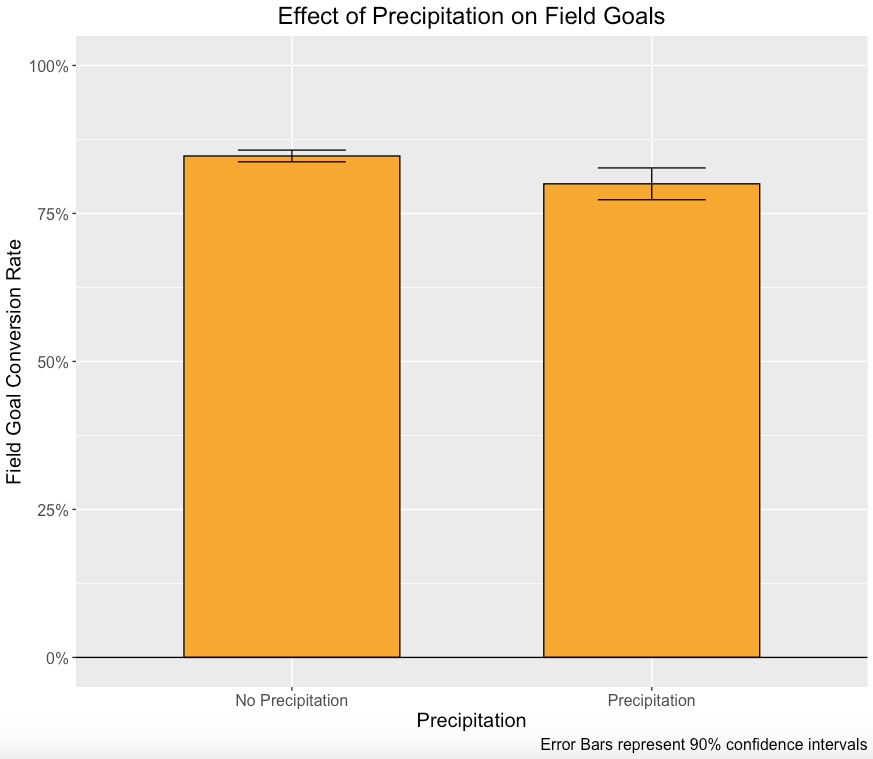
By looking at the field goal percentage with precipitation compared to the field goal percentage without precipitation, it is apparent that precipitation has a large effect. The field goal percentage for kicks without precipitation was 84.7%, very significantly greater than the field goal percentage of 80.0% for kicks with precipitation (p-value for difference greater than zero equals 0.001788). This does not even account for the fact that kicks in precipitation had a lower average distance and hence were easier to make.
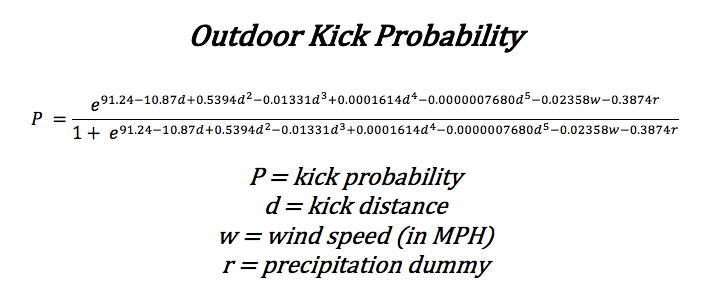
Putting it Together: Outdoor Kick Probability
The formula for the probability of converting a kick outdoors is much more complicated than for that of converting a kick indoors. The variable for distance goes up to the fifth power in order to capture the difficulty of really long field goal attempts. (That’s why the line is really curvy) In addition, I had to include the wind speed variable and precipitation variable. The weather dataset that I used had the exact amount of precipitation in inches during the game, but for purposes of simplicity and usability, I only included a dummy variable for precipitation, where a kick during rain or snow had a value of 1 while a kick without rain or snow had a value of 0. The wind speed and precipitation variables were both significant in the regression, as the wind speed variable had a p-value of 0.02679 while the precipitation dummy variable had a p-value of 0.00159.
The Effect of Extreme Weather
It is more difficult to comprehend exactly how much of an effect distance, wind speed, and precipitation have in a logistic regression than in a linear regression as the slopes affect the log odds, not the actual value. Therefore, I will show the effect using several scenarios incorporating different wind speeds, distances, and precipitation.
First, let’s use the average field goal distance, 38 yards, to see the effect of wind speed. The minimum wind speed in the sample of outdoor kicks was 0 MPH, the mean was about 7.8 MPH, and the maximum was 26 MPH. The probability of making a 38 yard field goal attempt with no wind (0 MPH) is 91.8%, with average wind (7.8 MPH) is 90.3%, and with maximum wind is 85.8%. From these values, it seems that wind speeds have a mild affect with average wind, but can have a large effect when speeds get very high as the probability decreased 6% in 26 mile per hour winds. The highest wind speed during a game in the 2020 NFL season (not included in the dataset) was 35 miles per hour in the Raiders vs Browns game. A 38 yard field goal attempt in those winds has 83.1% chance of being made, which is over 8% less than in no wind.
When we evaluate even longer kicks, the effect of wind speed is even more obvious. For example, a 55 yard field goal attempt in no wind has a 73.3% chance of being made, but that decreases to a 69.6% chance in average winds, and a very low 54.7% chance in 35 mile per hour winds. The difference between no wind and 35 miles per hour winds is over 19% in kick probability, exhibiting the difficulty of making a long field goal in high wind speeds.
Now, let’s analyze the effect of precipitation on field goal probability. First, we can use the average distance of 38 yards and the average wind speed of 7.8 MPH. A field goal attempt in those circumstances without precipitation has a 90.3% chance of being made, but in those circumstances with precipitation has a 86.3% chance of being made. Once again, the effect is even greater with longer kicks. A 55 yard attempt in average wind and no precipitation has a 69.6% chance, but the same kick in precipitation has just a 60.8% chance, almost 9% lower.
Stadium Weather Conditions
Now that we have seen the impact of wind speed and precipitation on outdoor field goal attempts, we can see which outdoor stadiums are the most kicker friendly and which are the most difficult for kickers. Obviously, dome stadiums and retractable stadiums always are good for kickers since they do not have to deal with bad weather. In order to see which locations have the best and worst weather for kickers, I found the average wind speed and percent of games with precipitation for each stadium from 2015-2019.

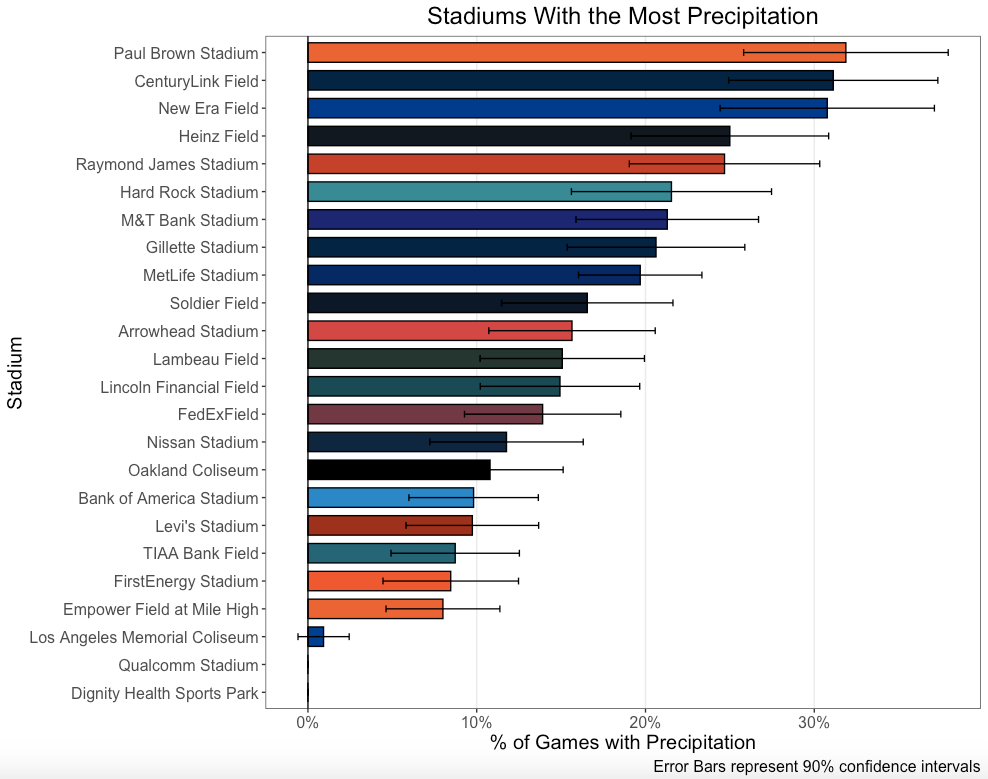
The graphs above show the average weather conditions for all the outdoors stadiums with at least 50 games played from 2015 to 2019. The stadiums with the highest wind speeds are FirstEnergy Stadium (Cleveland), New Era Field (Buffalo), and Hard Rock Stadium (Miami), and those with the most precipitation are Paul Brown Stadium (Cincinnati), CenturyLink Field (Seattle), and New Era Field (Buffalo). Three locations appear in the top 10 worst conditions for both wind speed and precipitation: Buffalo (New Era Field), Miami (Hard Rock Stadium), and Chicago (Soldier Field). Kickers that play for the Bills, Dolphins, and Bears have more difficult kicking conditions, on average, due to their high chance of precipitation and high wind speeds. Therefore, kickers that play in those locations are likely undervalued, given they have a similar distribution of kick distances as the league.
On the other hand, the three locations with the least wind are Carolina (Bank of America Stadium), Los Angeles (Los Angeles Memorial Coliseum), and Seattle (CenturyLink Field), and those with the least precipitation are Los Angeles/San Diego (Dignity Health, Qualcomm, and LA Memorial Coliseum), Denver (Empower Field at Mile High), and Cleveland (FirstEnergy Stadium). Three stadiums appear in the top 10 best conditions for both wind speed and precipitation: Los Angeles Memorial Coliseum, Qualcomm Stadium, and Bank of America Stadium. The Los Angeles and San Diego area seems to be the best place for outdoor kicking, but both LA teams moved into SoFi Stadium, a dome, this past season. Other than Southern California, Carolina is the best outdoor stadium for kickers. Bank of America stadium has an average wind speed of just 3.9 MPH (least of current outdoor stadiums) and precipitation in just 9.8% of games (5th least of current outdoor stadiums).

The Best Kickers
Season Stats (2015-2019)
Using the field goal probability given the kick distance and weather conditions, I found the best seasons for kickers from 2015 to 2019. I ranked the kickers using FGPOE, Field Goal Percentage Over Expected, which was found by subtracting a kicker’s expected field goal percentage from his actual field goal percentage. All the kickers displayed in the graph below had at least 15 field goal attempts.
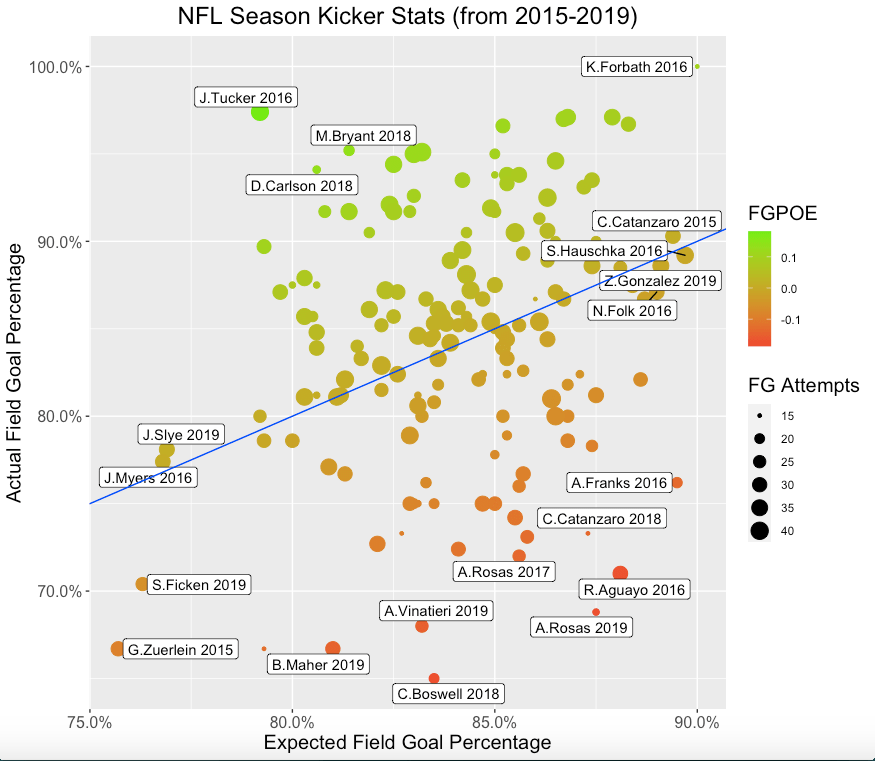
The points that are the most green are those with the highest FGPOE. The players located on the top right of the graph had a high actual field goal percentage and high expected field goal percentage, those on the top left had a high actual field goal percentage and a low expected field goal percentage, those in the bottom right had a low actual field goal percentage and a high expected field goal percentage, and those in the bottom left had a low actual field goal percentage and a low expected field goal percentage.
The best season for a kicker from 2015-2019 was Justin Tucker’s 2016 season by a wide margin. Tucker made 38 of 39 field goals (97.4%) when his expected field goal percentage was 79.2%, good for a FGPOE of 18.2%. The next best seasons were Matt Bryant in 2018 and Daniel Carlson in 2018. The worst season by a kicker was Aldrick Rosas in 2019 as his actual field goal percentage was 68.8% while his expected field goal percentage was 87.5% (FGPOE = -18.7%). The second and third worst seasons belonged to Chris Boswell in 2018 (FGPOE = -18.5%) and Roberto Aguayo in 2016 (FGPOE = -17.1%).
Career Stats (2015-2019)
By looking at all the kicks a kicker took from 2015 to 2019, we can see which kickers have been the best over the past 5 years.
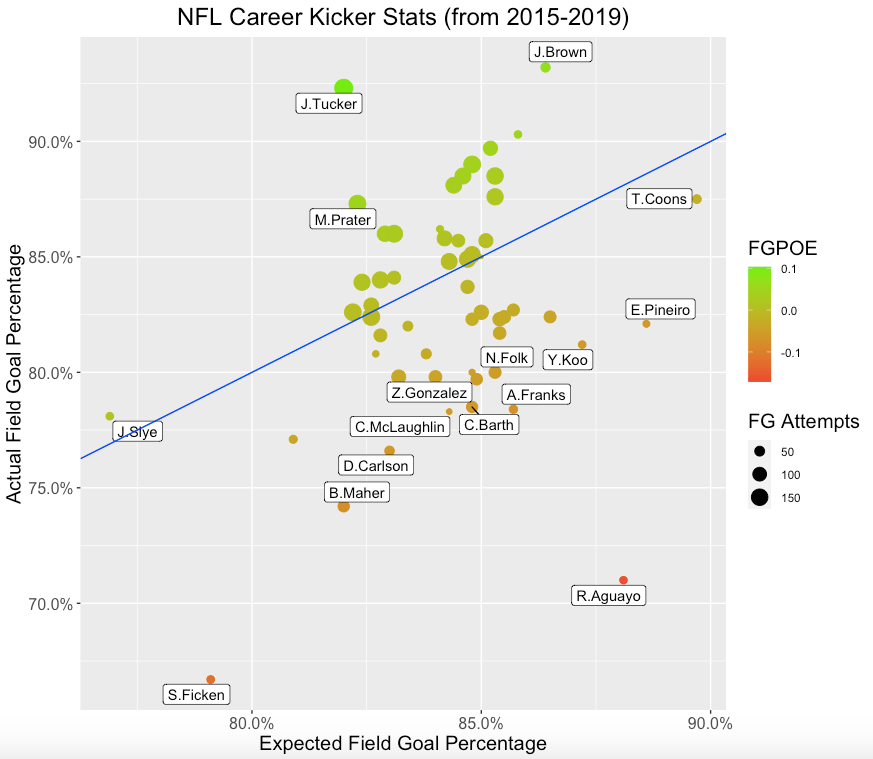
The best kicker, again by a wide margin, has been Justin Tucker. His career FGPOE of 10.3% is 3.5 percentage points greater than the second best mark of 6.8%, which belongs to Josh Brown. The third best kicker has been Matt Prater, with a FGPOE of 5.0%. On the other hand, the worst kickers have been Roberto Aguayo (FGPOE = -17.1%), Sam Ficken (-12.4%), and Brett Maher (-7.8%). The kicker with the most challenging field goal attempts has been Joey Slye, with an average kick distance of 43.3 yards, well above the league average of 38. The kickers with the easiest field goal attempts were Travis Coons and Eddy Pineiro, both with an average kick distance close to 34 yards.
2020 Stats
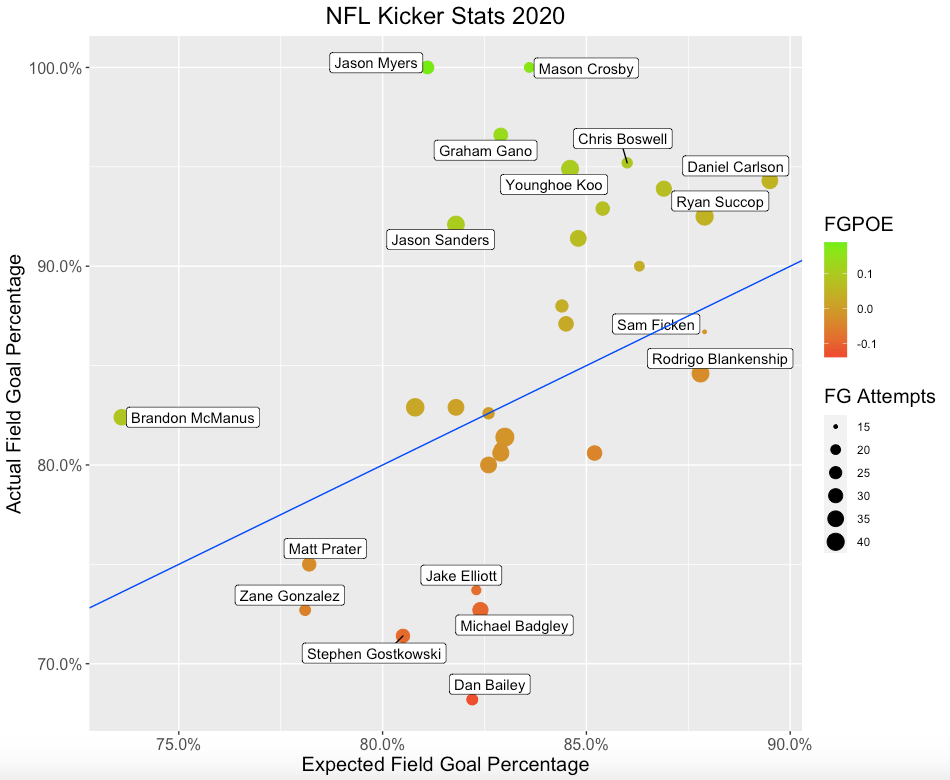
Using a different dataset for field goal attempts and weather, I found the FGPOE for the kickers during the 2020 NFL season. The best kicker this season was Jason Myers, who made all 26 of his kicks despite an expected field goal percentage of 81.1%. The next best kickers were Mason Crosby (FGPOE = 16.4%), who also made all his field goals, and Graham Gano (FGPOE = 13.7%), who only missed one field goal. On the other hand, the worst kickers were Dan Bailey (FGPOE = -14.0%), Michael Badgley (FGPOE = -9.7%), and Stephen Gostkowski (FGPOE = -9.1%). The kicker with the most difficult attempts this season was Brandon McManus, whose average kick was from 44 yards. Meanwhile, the kickers with the easiest kicks were Daniel Carlson and Ryan Succop, both expected to make over 87% of their attempts. Carlson and Succop are overvalued by current kicking stats as they are expected to make more of their field goals than other kickers like McManus, who is undervalued by current kicking stats since his lower field goal percentage is a result of his difficult attempts.
Conclusion
Kickers are an under appreciated group of football players. Their kicks can win games on the biggest of stages as several Super Bowls have come down to a final field goal attempt. For indoor kicks, kick probability only depends on kick distance, but for outdoor kicks, weather factors like precipitation and wind speed have to be included. The most kicker friendly outdoor stadium is the Bank of America Stadium in Carolina since there is a low chance of precipitation and low average wind speeds. Conversely, the most difficult stadiums for kickers are New Era Field in Buffalo, Hard Rock Stadium in Miami, and Soldier Field in Chicago as a result of high wind speeds and higher chances of precipitation. Using the expected and actual field goal percentages, I created the FGPOE stat. The best season according to FGPOE belonged to Justin Tucker in 2016, while the worst belonged to Aldrick Rosas in 2019. The best kicker during their career from 2015-2019 was Justin Tucker, and the worst was Roberto Aguayo. Using the field goal attempts from this season, Jason Myers was the best kicker and Dan Bailey was the worst. Field Goal Percentage Over Expected is a stat that better evaluates kicker performance than the current basic kicking stats.
